
One matrix for every orchestrator
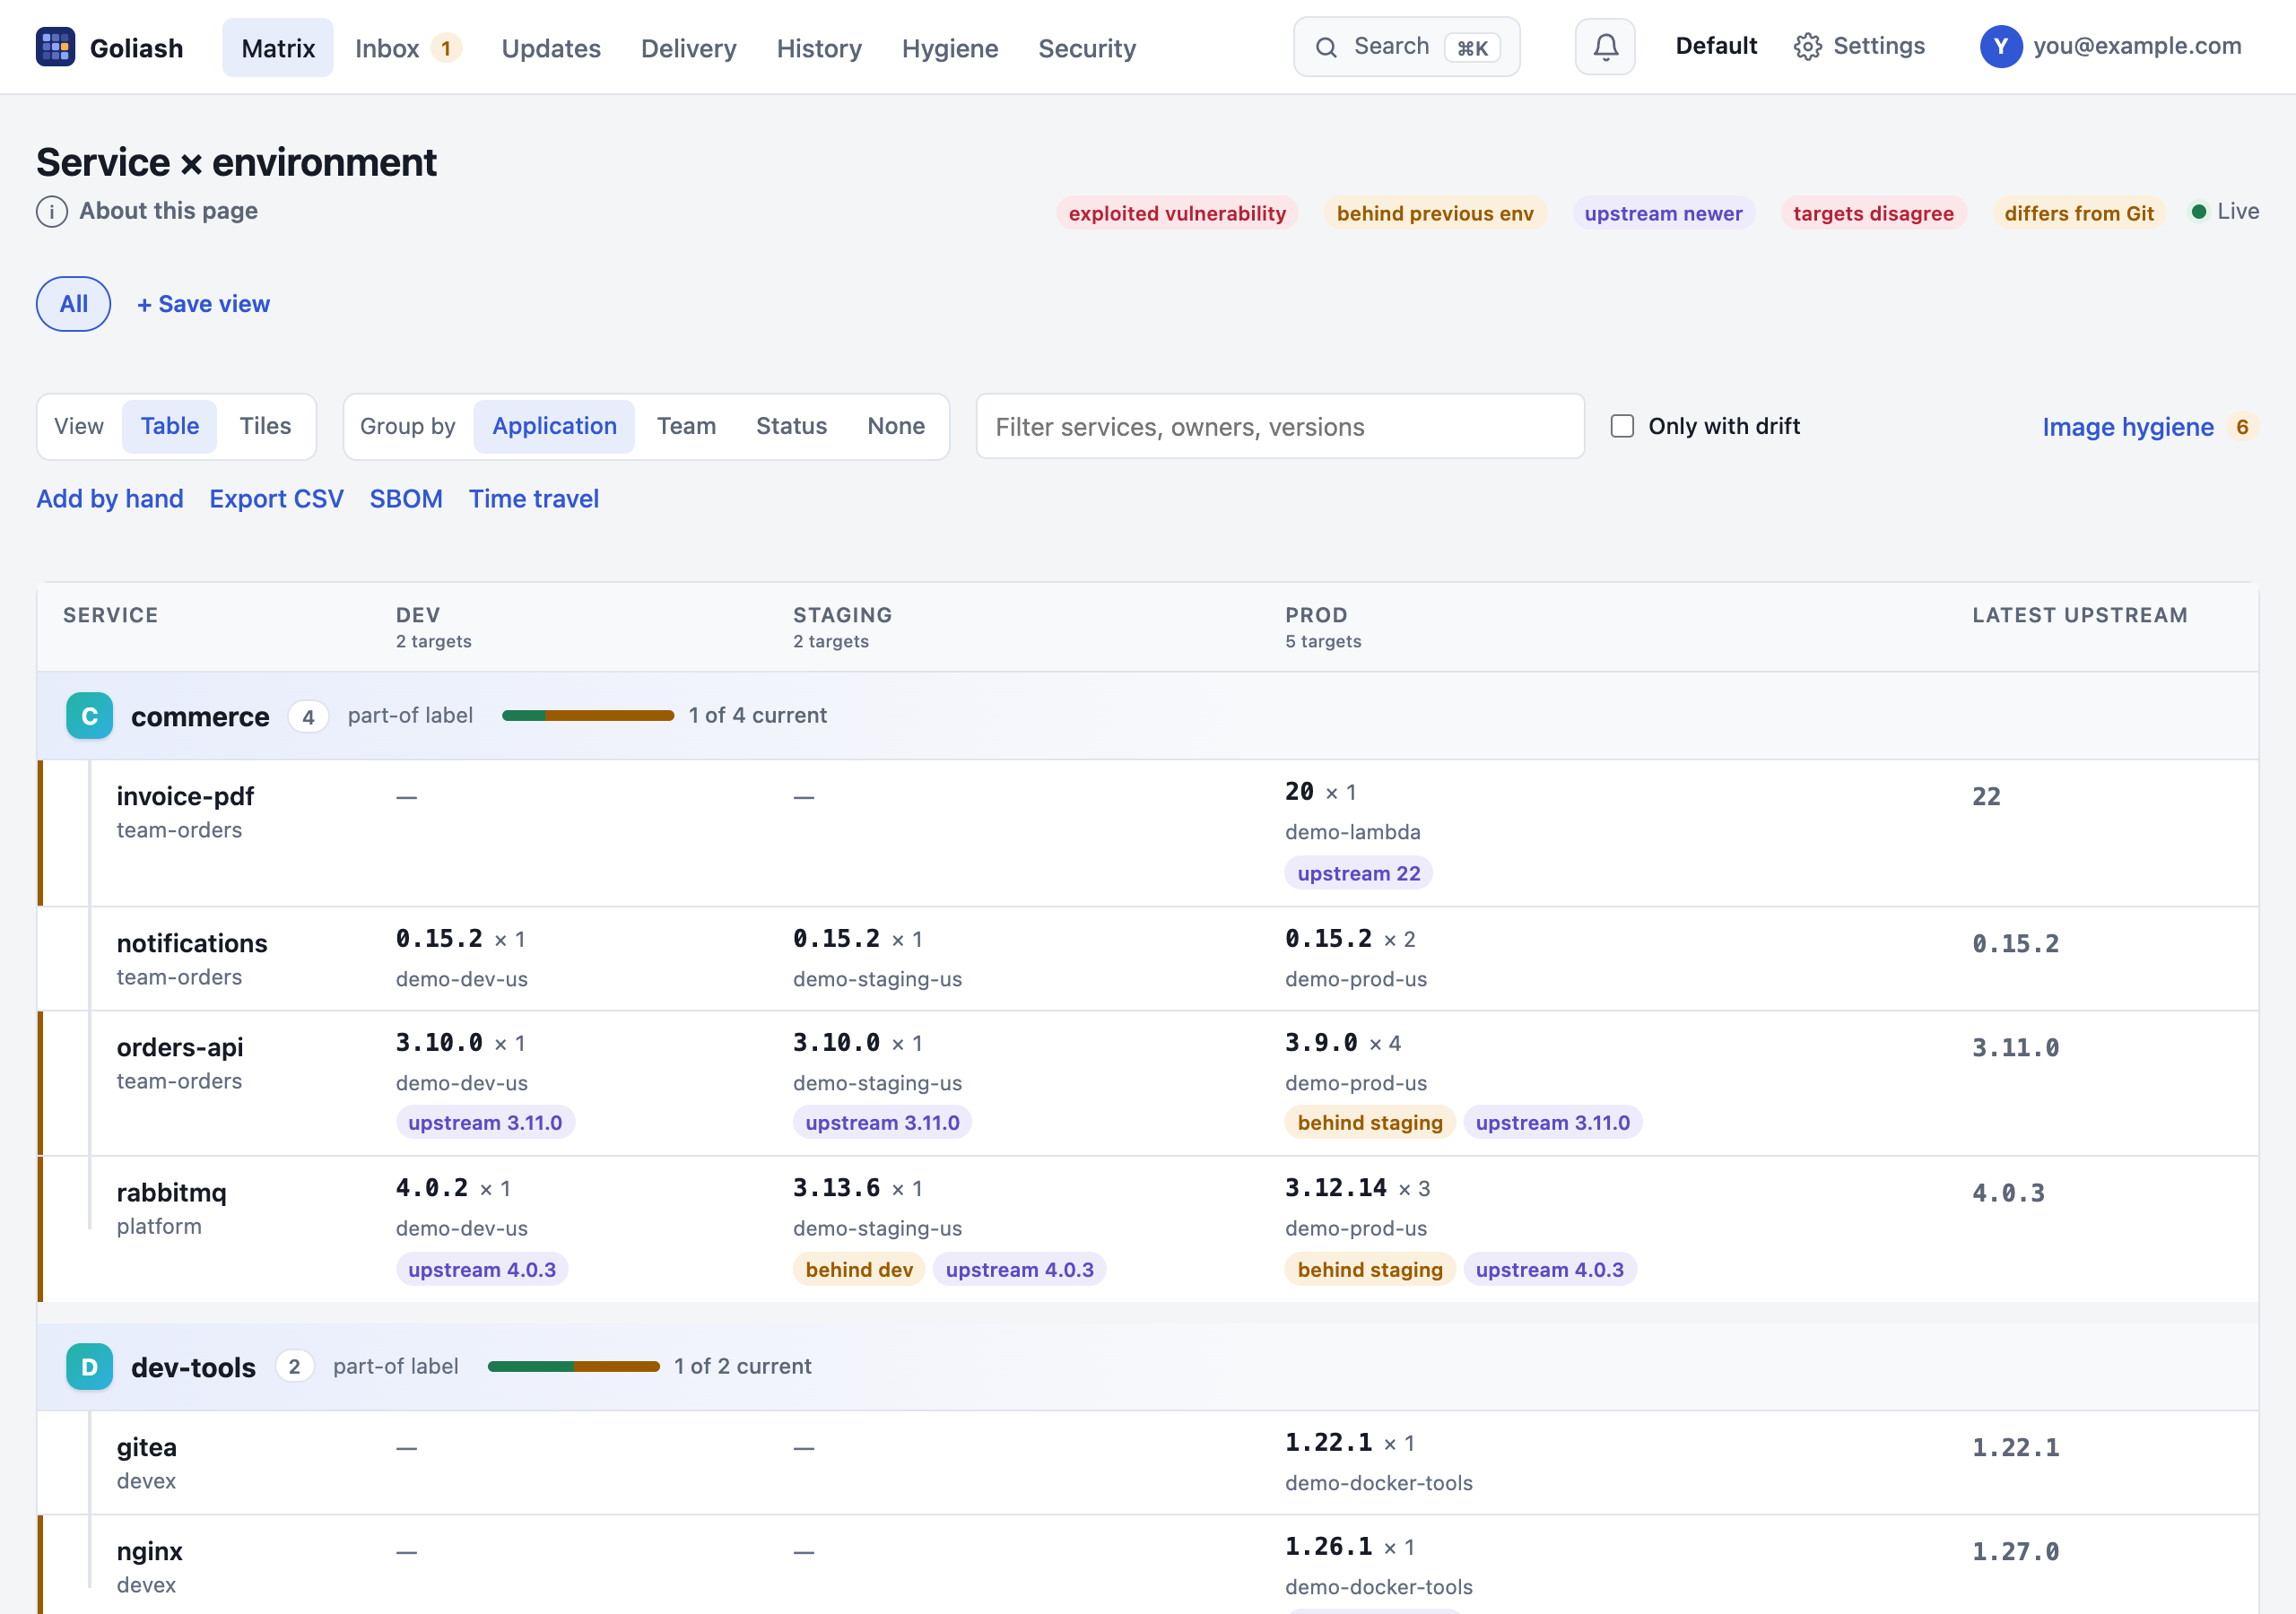
Kubernetes, Amazon ECS, AWS Lambda, Nomad, Docker Swarm, Docker hosts and plain Compose files side by side, per environment, with replicas and rollouts in progress. Grouped by application, team, cluster or status.
🔀identity-staging degraded after keycloak 25.0.6Rollback PR → 25.0.1
🎯webshop-staging out of sync: Git pins 1.7.0, 1.6.0 runsSync it
📬Renovate already proposed payments-api 1.7.0Linked, not duplicated
🚨CVE-2024-6387 exploited in the wild, runs in prodOpen PR → 9.8p1
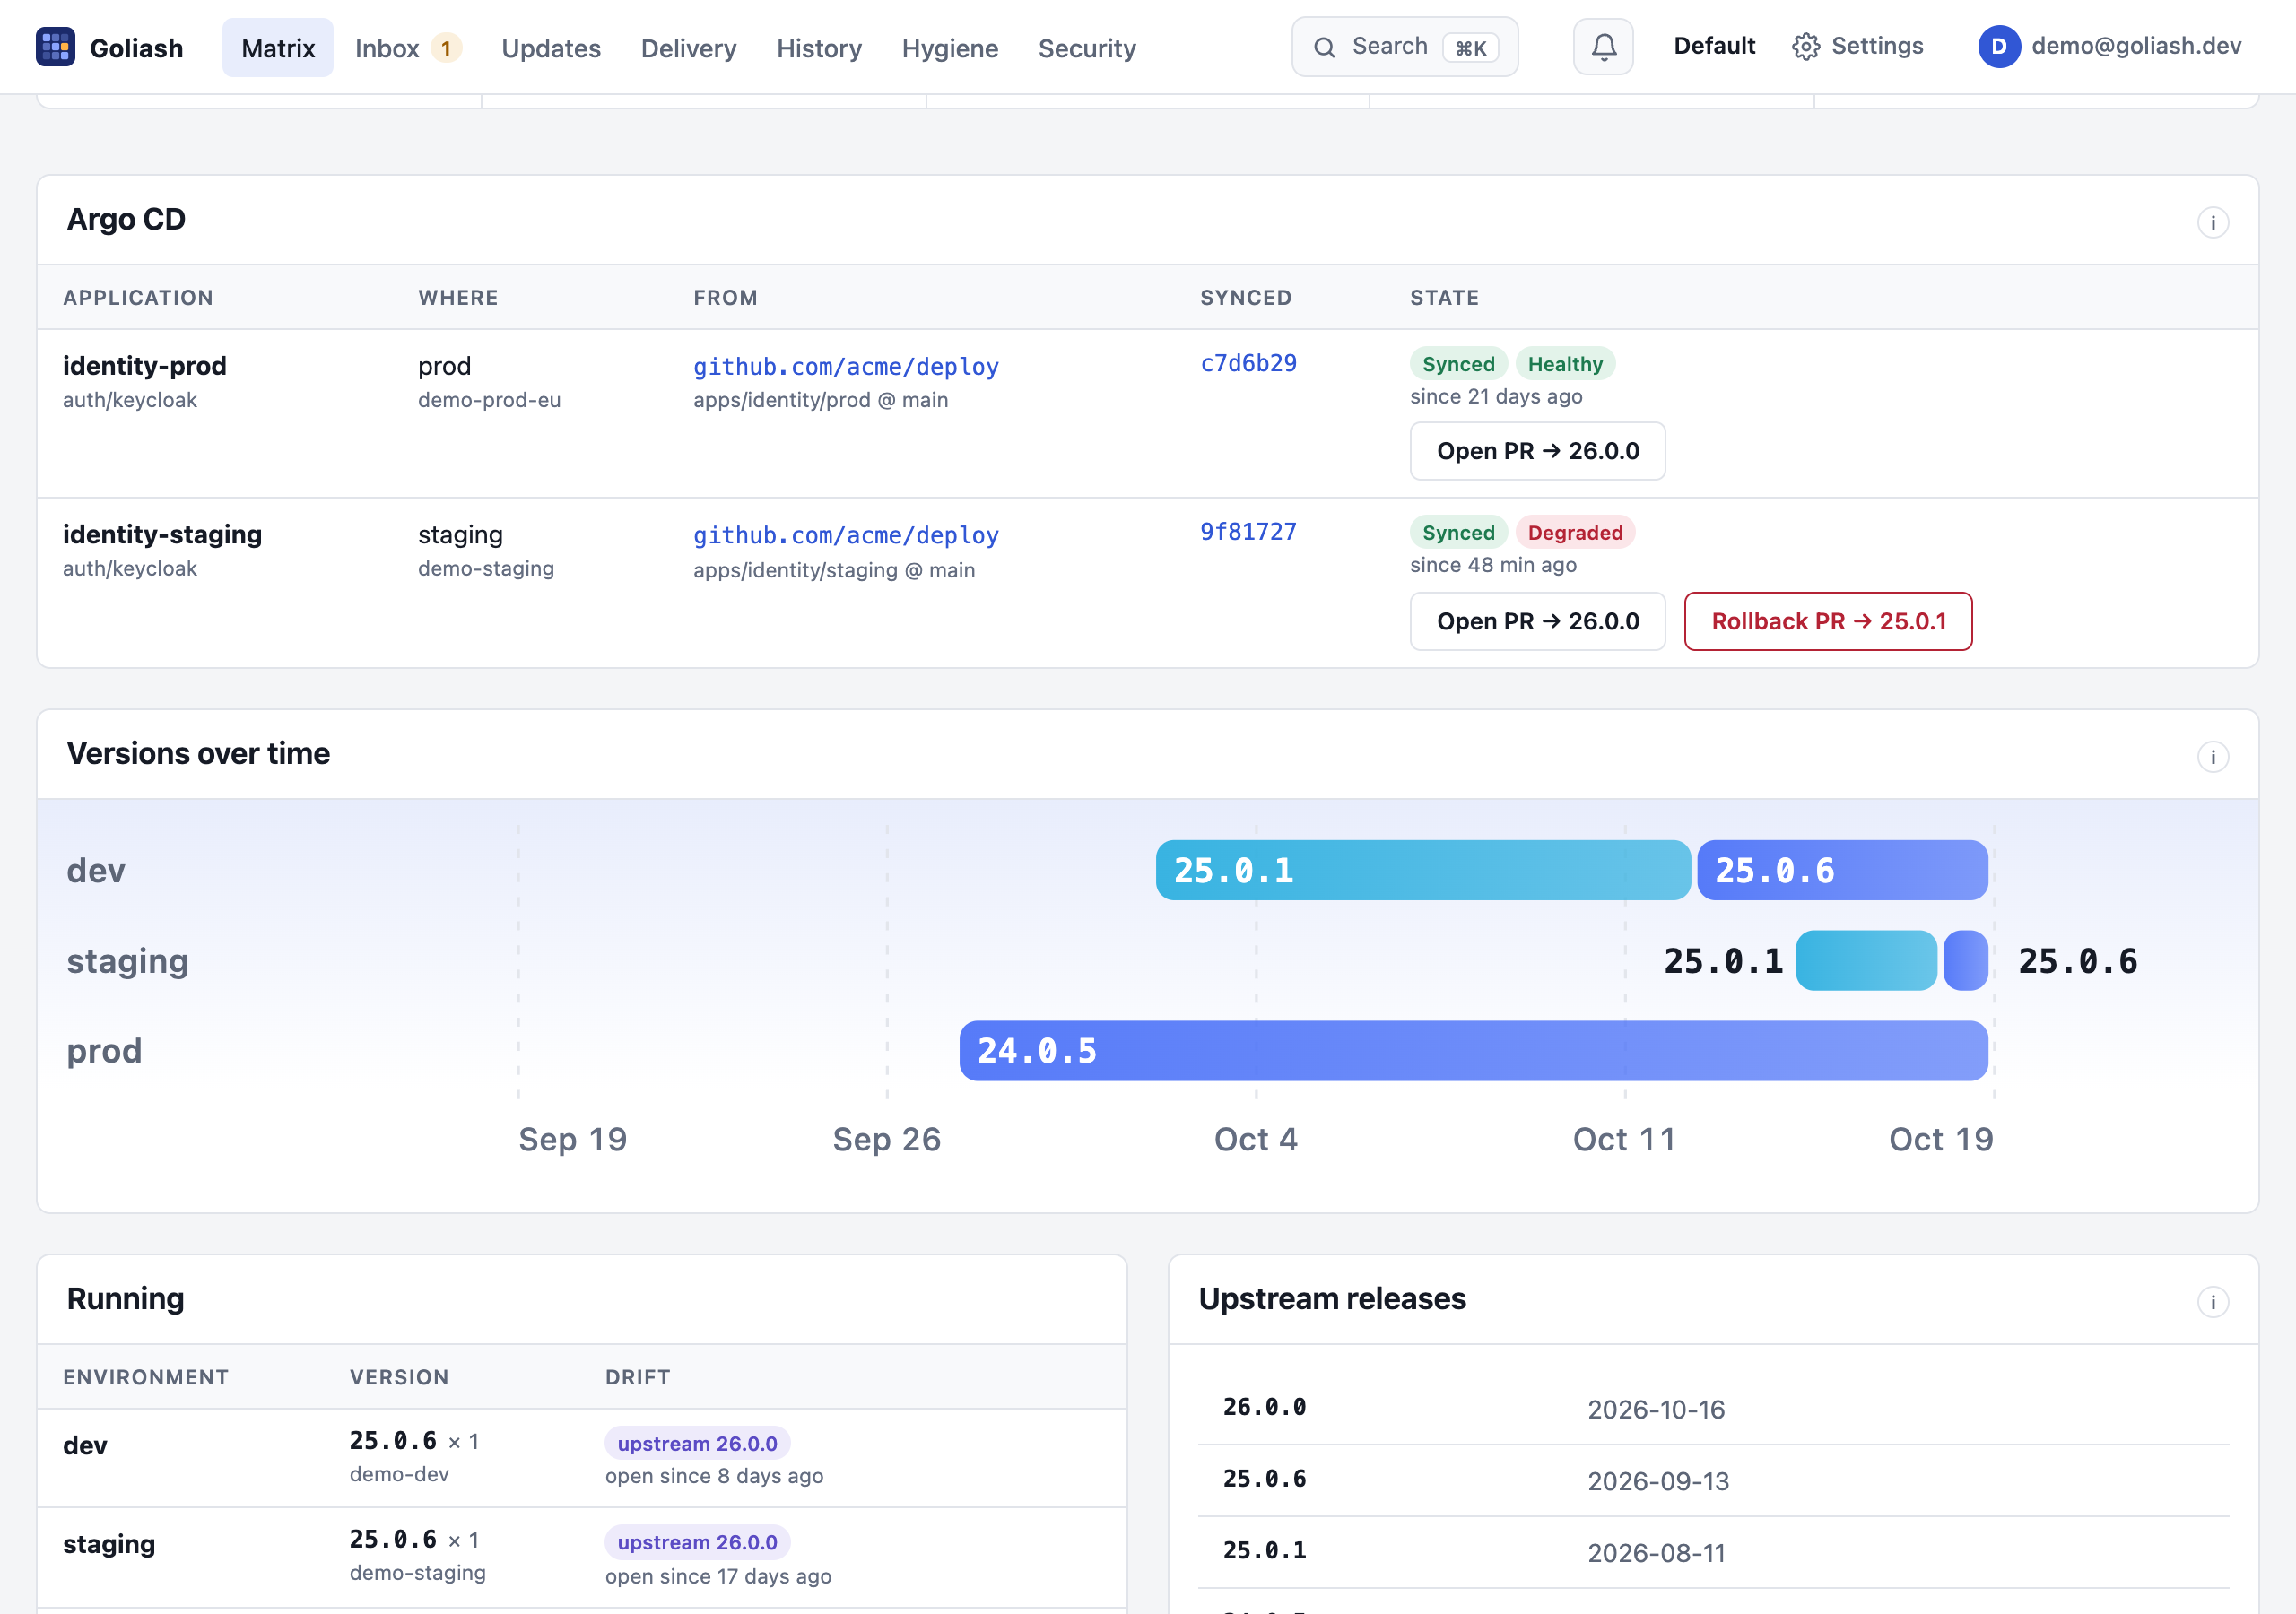
Goliash watches what actually runs and tells you when a new release ships or when environments drift apart: staging on 1.5.0 while prod is still on 1.3.2, or two prod clusters disagreeing.
One matrix for every orchestrator
Kubernetes, Amazon ECS, AWS Lambda, Nomad, Docker Swarm, Docker hosts and plain Compose files side by side, per environment, with replicas and rollouts in progress. Grouped by application, team, cluster or status.
Applications, not just containers
Workloads are grouped by the application they belong to, from Kubernetes, Helm and Compose labels or Nomad jobs. Projects deployed with Dokploy or Nomploy come together under one name. A database image shared by several apps is compared within each app, so different apps on different versions are not drift.
Upstream awareness
Tags from Docker Hub, GHCR, Quay, ECR, Google Artifact Registry, Azure ACR and private registries, compared
with semver policies. Moving tags resolved by digest: 1 is shown as 1 = 1.27.3. Release dates and notes from
GitHub, found through a built-in catalog or the image’s own source label.
Know what to upgrade first
The Updates page lists every upgrade with its target version, most urgent first: an image with a vulnerability exploited in the wild, a release that fixes vulnerabilities, end of life, then major, minor and patch, production first. Filter it, tick all shown and open the pull requests together; copy it as a checklist, or get it every Monday as an upgrade plan in Slack or e-mail.
Upgrades as pull requests
Upgrades, promotions and rollbacks open as pull requests on GitHub, GitLab, Gitea or Forgejo, changing the tag in manifests, Kustomize, Helm values, Nomad jobs, Compose files or Terraform. Previewed first, with why, the vulnerabilities they fix and the licenses they bring; a whole application in one; Renovate’s linked, not duplicated; held back during a change freeze or an Argo CD sync window.
A merge is not a deploy
A merged pull request whose version does not run yet is shown and announced, with why it waits: a sync window, a suspended Flux object, an Argo CD application synced by hand. The Delivery page measures merge to running.
Fixed before scanners know
Projects fix before their CVEs reach scanners. Goliash reads release notes and feeds (php.net) and announces a
security release to every service on an older version the hour it ships. After an advance notice, watch php:
see what runs it now, hear of its next release first.
Find anything
⌘K jumps to a service by the image, version, workload or GitOps application it runs, to a team, or to where a CVE
runs. Every page filters with /, and one search looks through services, vulnerabilities, packages, pull
requests and history, for you, your scripts and your AI assistant.
Drift that matters
An environment behind the one before it, a version behind upstream, a release cycle at its end of life, a host that runs something other than Git declares: shown at once, announced only when it lasts.
Did the deploy go out?
Rollouts stuck half way, services running none of their replicas and rollbacks to an older version, from Kubernetes, ECS, Nomad, Swarm and Compose: first on the Delivery page, announced, and counted as a change failure rate. Each version waiting for production says which known vulnerabilities promoting it fixes and brings.
What the image is made of
What pulling each image costs over time, the layers the last deploy added with the Dockerfile step of each, a size budget per service, and images built on an outdated build of their base image.
History without CI
Every deploy, rollout, retag and removal, read from the runtime itself, not from pipelines. Scrub the timeline back through 400 days and watch versions change, or play the deployments back one by one.
An SBOM of what actually runs
Not one image at build time: every image in every environment, read from the runtime, with its digest, where it runs and the packages inside, as CycloneDX 1.6. For now or any past moment, straight into Dependency-Track.
Notifications with less noise
Slack, Microsoft Teams, Google Chat, Discord, Telegram, ntfy, signed webhooks, Grafana annotations, e-mail and browser push, instant or as daily or weekly digests, with acknowledgements and a scheduled upgrade plan per team.
Security posture
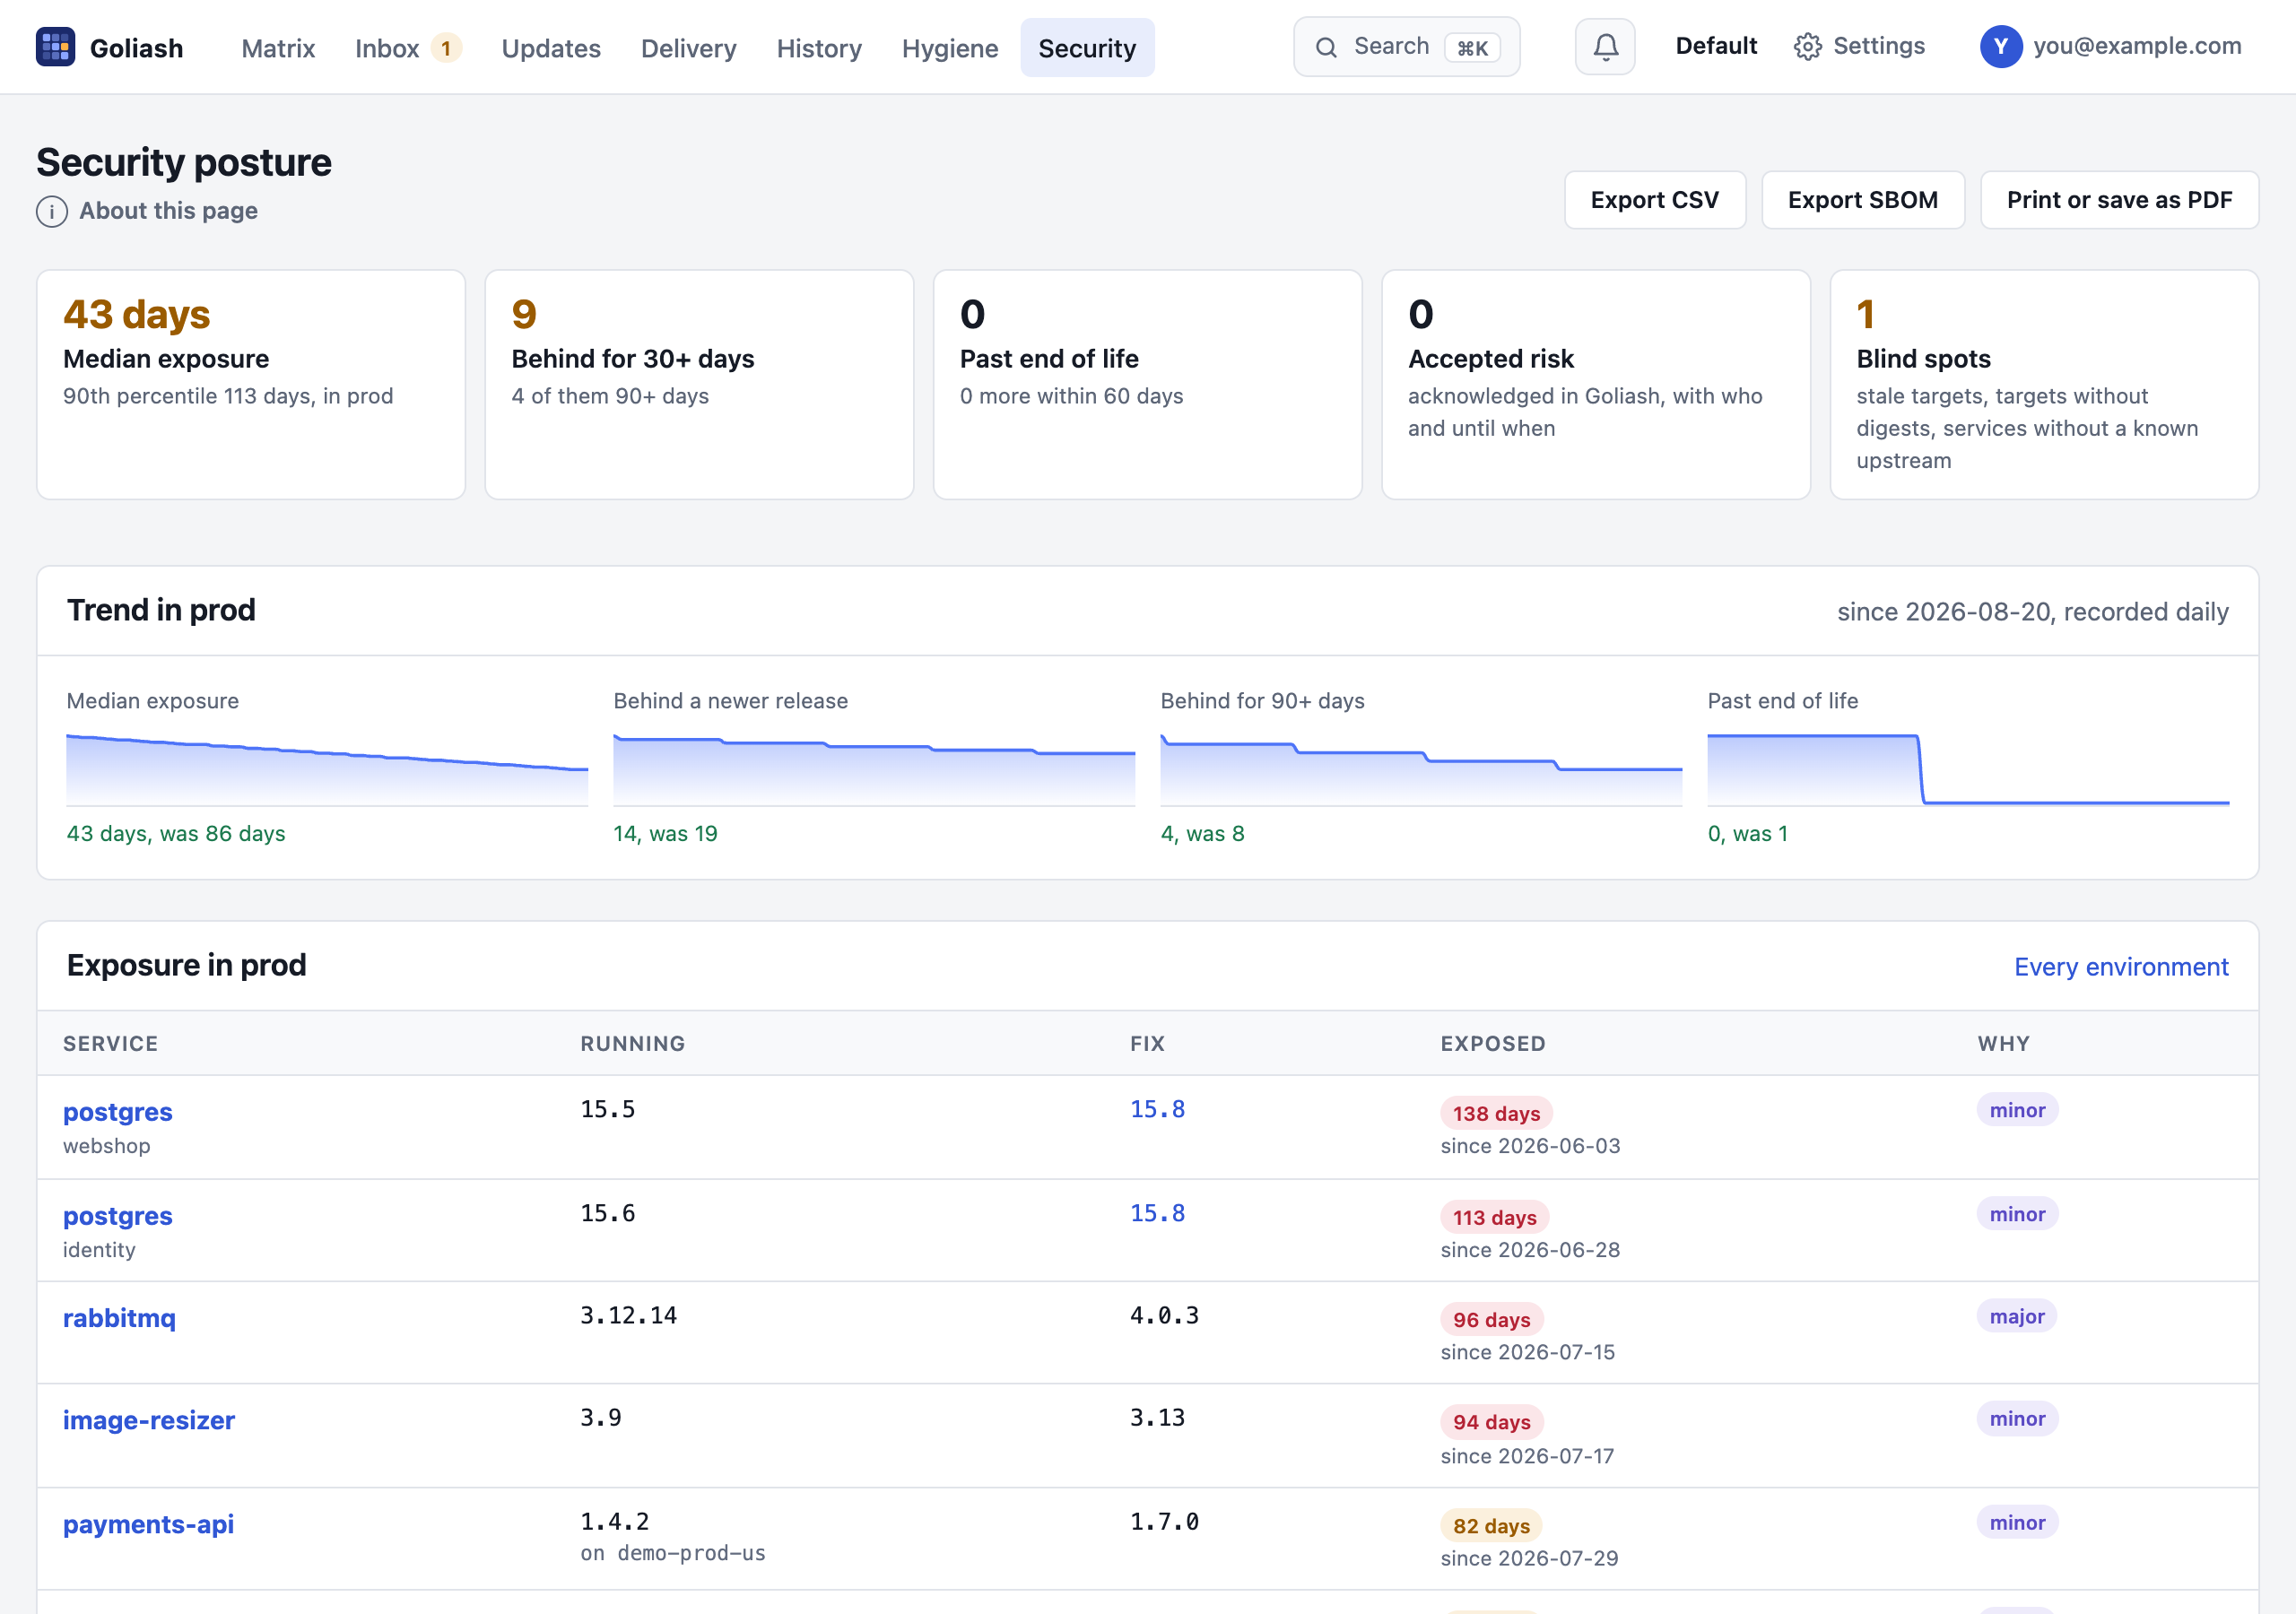
How long production has run behind an available release, what is past its end of life, accepted risk and blind spots (with why a newest release is unknown, and the fix), read from the runtime. Known vulnerabilities with how long each has run and CISA’s due dates, the version or base image that fixes each, and false positives (kernel packages, upstream fixes, the publisher’s VEX) left out with their reason. Export it as CSV or PDF for the risk register and the audit.
Licenses and signers
The license of every package in running images, AGPL, source-available and unknown ones first, and who signed each image, as its Sigstore certificate names the CI workflow or person, with an expected signer per service.
On your dashboards
Ready-made Grafana and SigNoz dashboards, deploy markers on your graphs and Prometheus alerts. Settings → Integrations fills in the scrape settings and the token; the Helm chart adds a ServiceMonitor too.
Ask your AI assistant
An MCP server built in: Claude, Cursor and others answer “what runs in prod?” or “what changed in the last two
hours?” from live data. They sign in with OAuth as you, read only; no token to copy. Try it on the demo:
claude mcp add --transport http goliash https://demo.goliash.dev/mcp.
Teams and saved views
Every service has a team, and each team a scorecard: exploited vulnerabilities, end of life, stuck rollouts, what is behind, with a brief from Goli. Show one team alone as its own board or TV screen, and save any view as a tab or your home page.
Connected in two clicks
Pick the platform and copy one command: the agent registers itself and finds what to watch, from a Docker host to every ECS cluster and Lambda function of a region. One code serves a whole fleet.
Read-only and self-hosted
Collectors only read; the agent only connects out. One binary each, SQLite or PostgreSQL, signed releases, passkeys and two-factor sign-in.
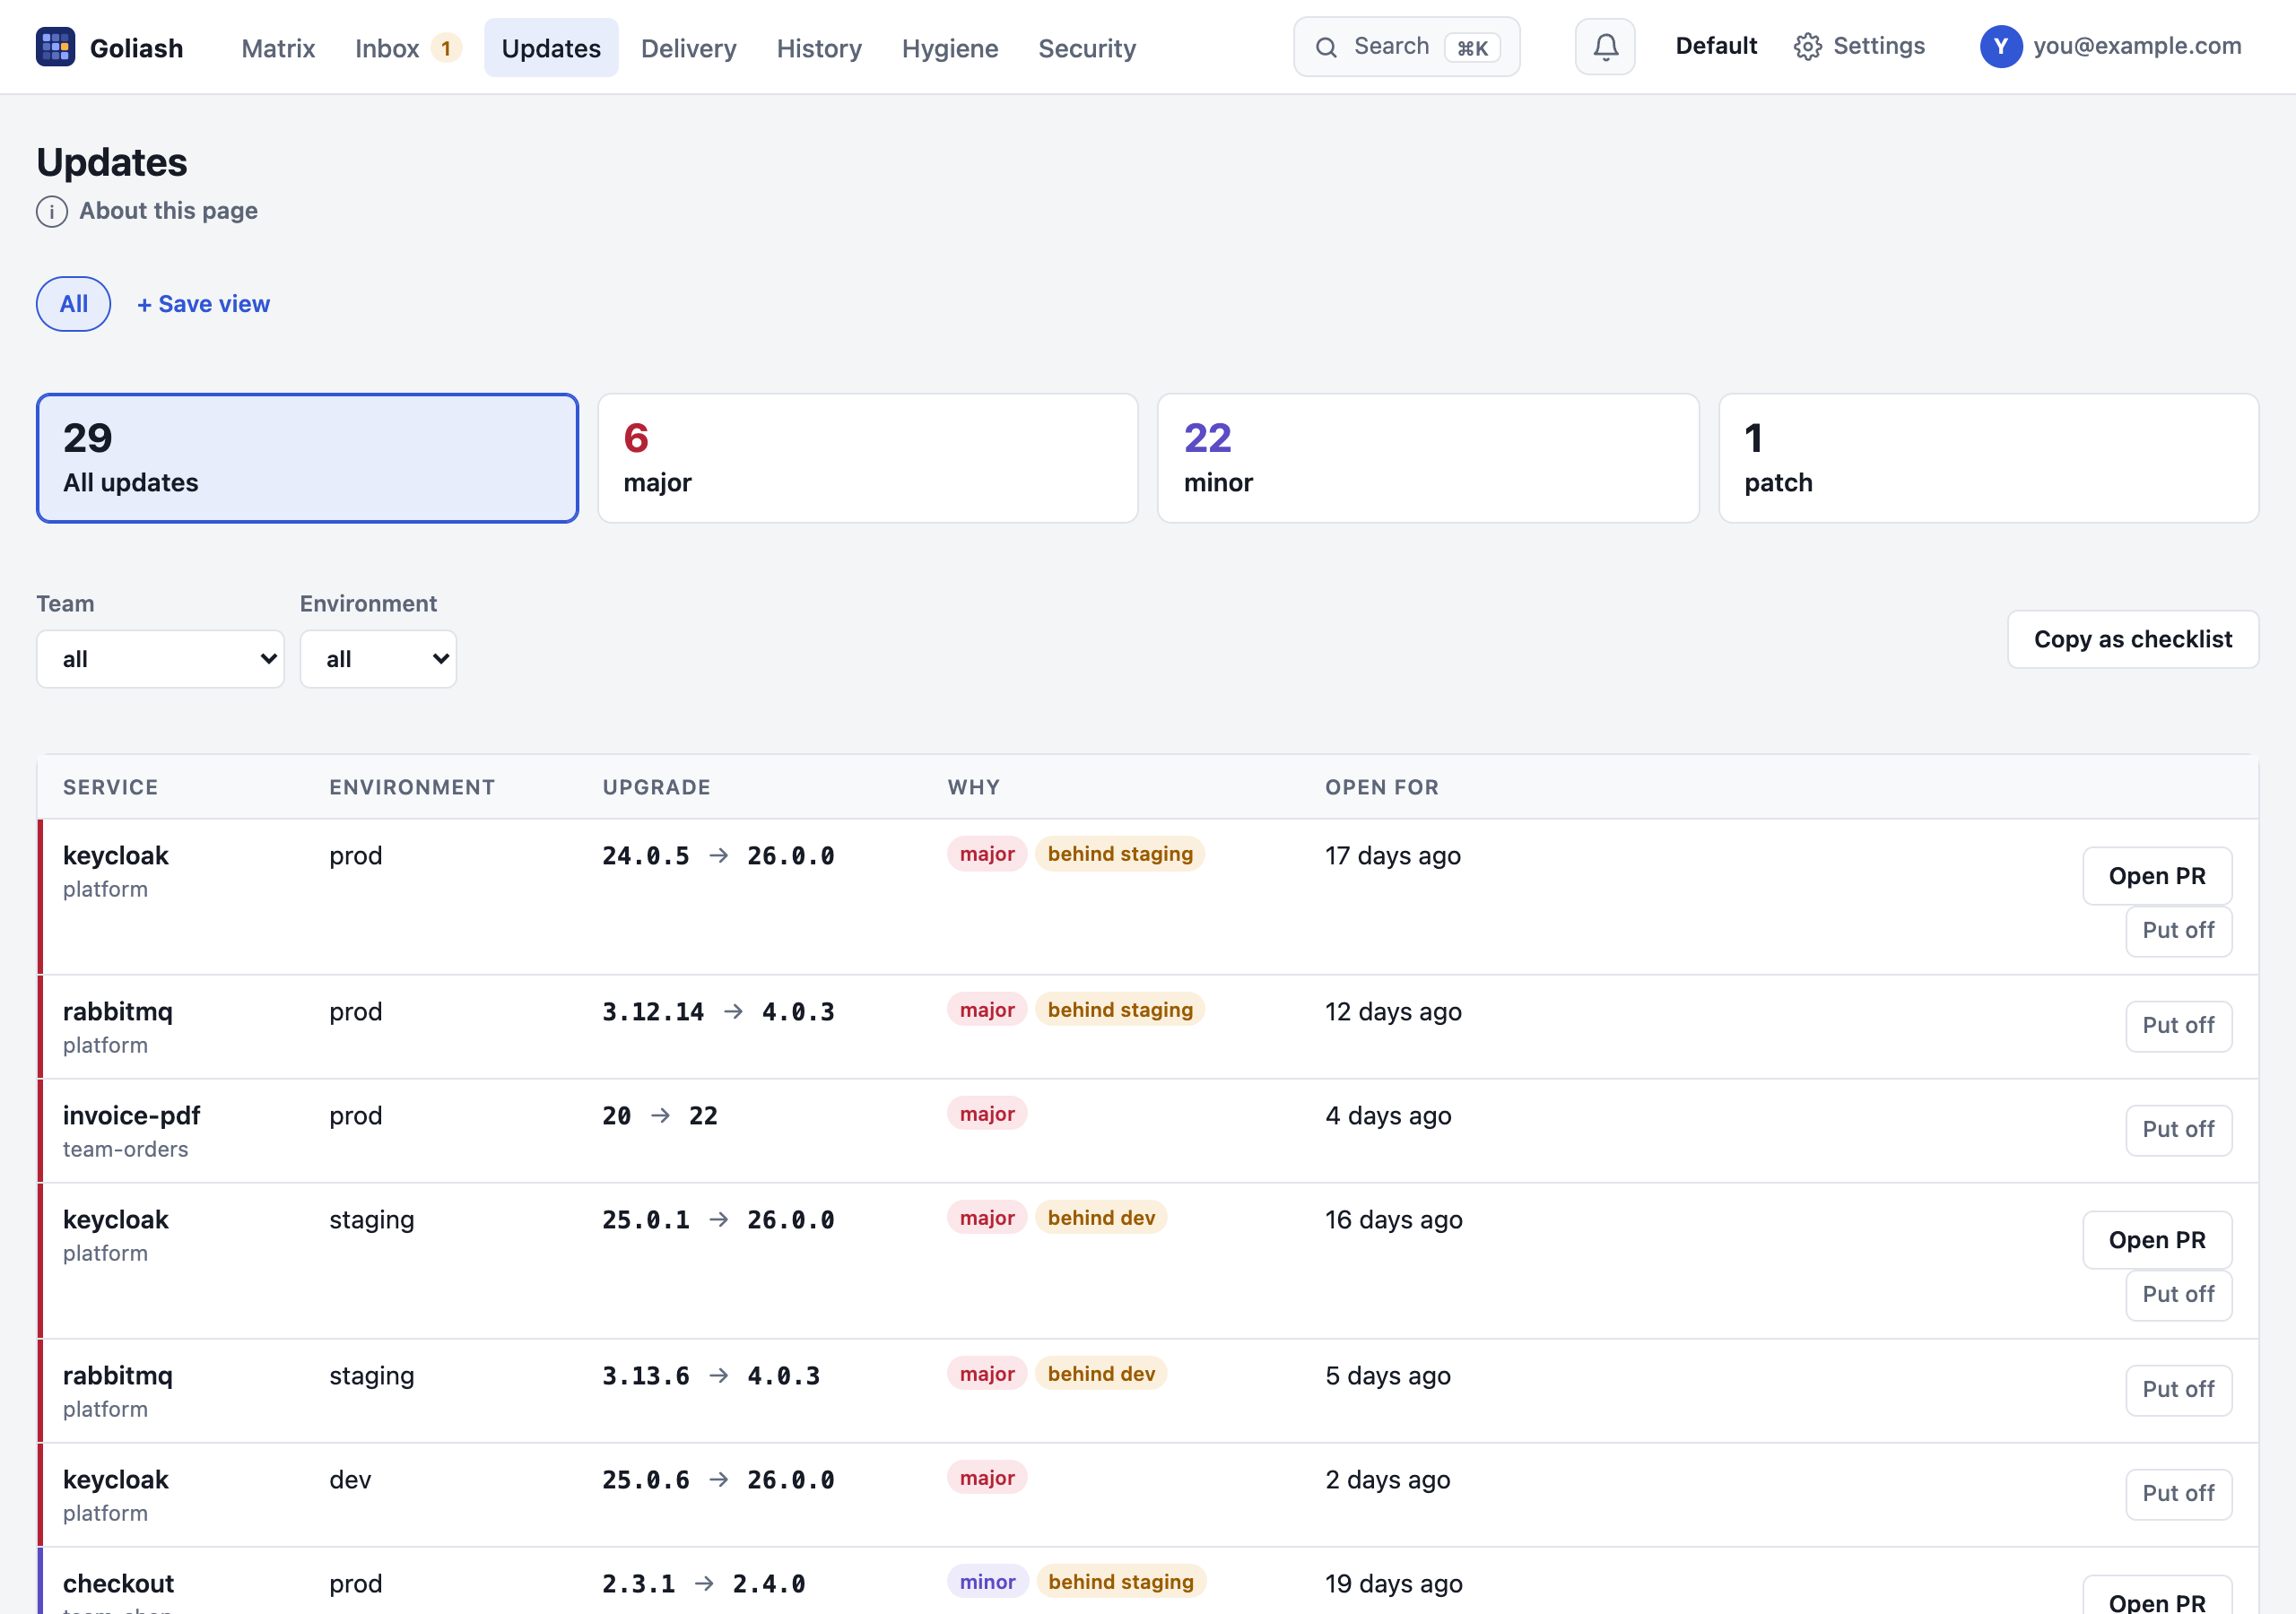
Updates turns drift into a to-do list: what runs, what to move to (with release notes) and why, the most urgent first.
Security says how long production has run behind an available fix, what is past its end of life and where Goliash cannot see, ready to export for the risk register or the audit.
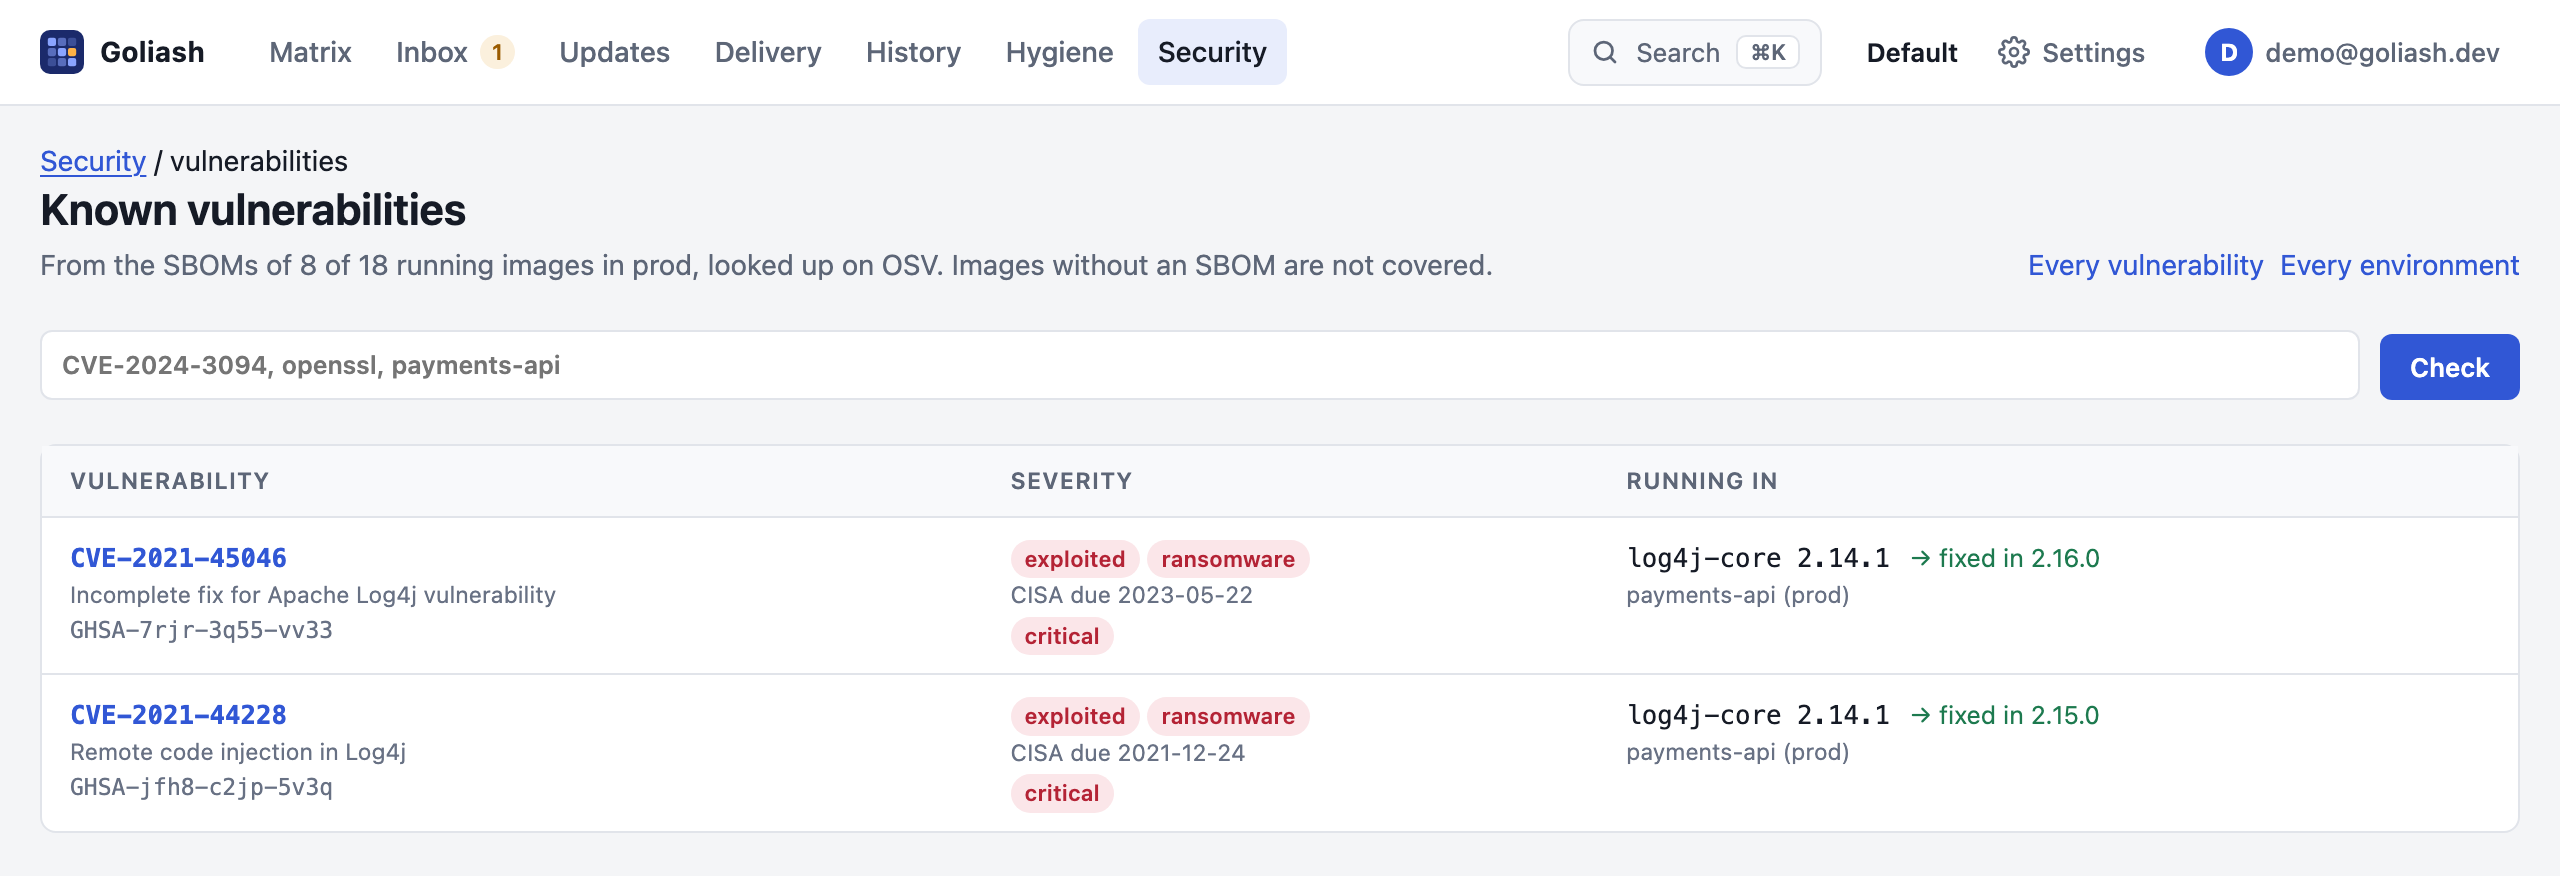
Is it running? answers “is Log4Shell in production?” from the images’ SBOMs: CVEs exploited in the wild first, with the service, the package and the version that fixes it.
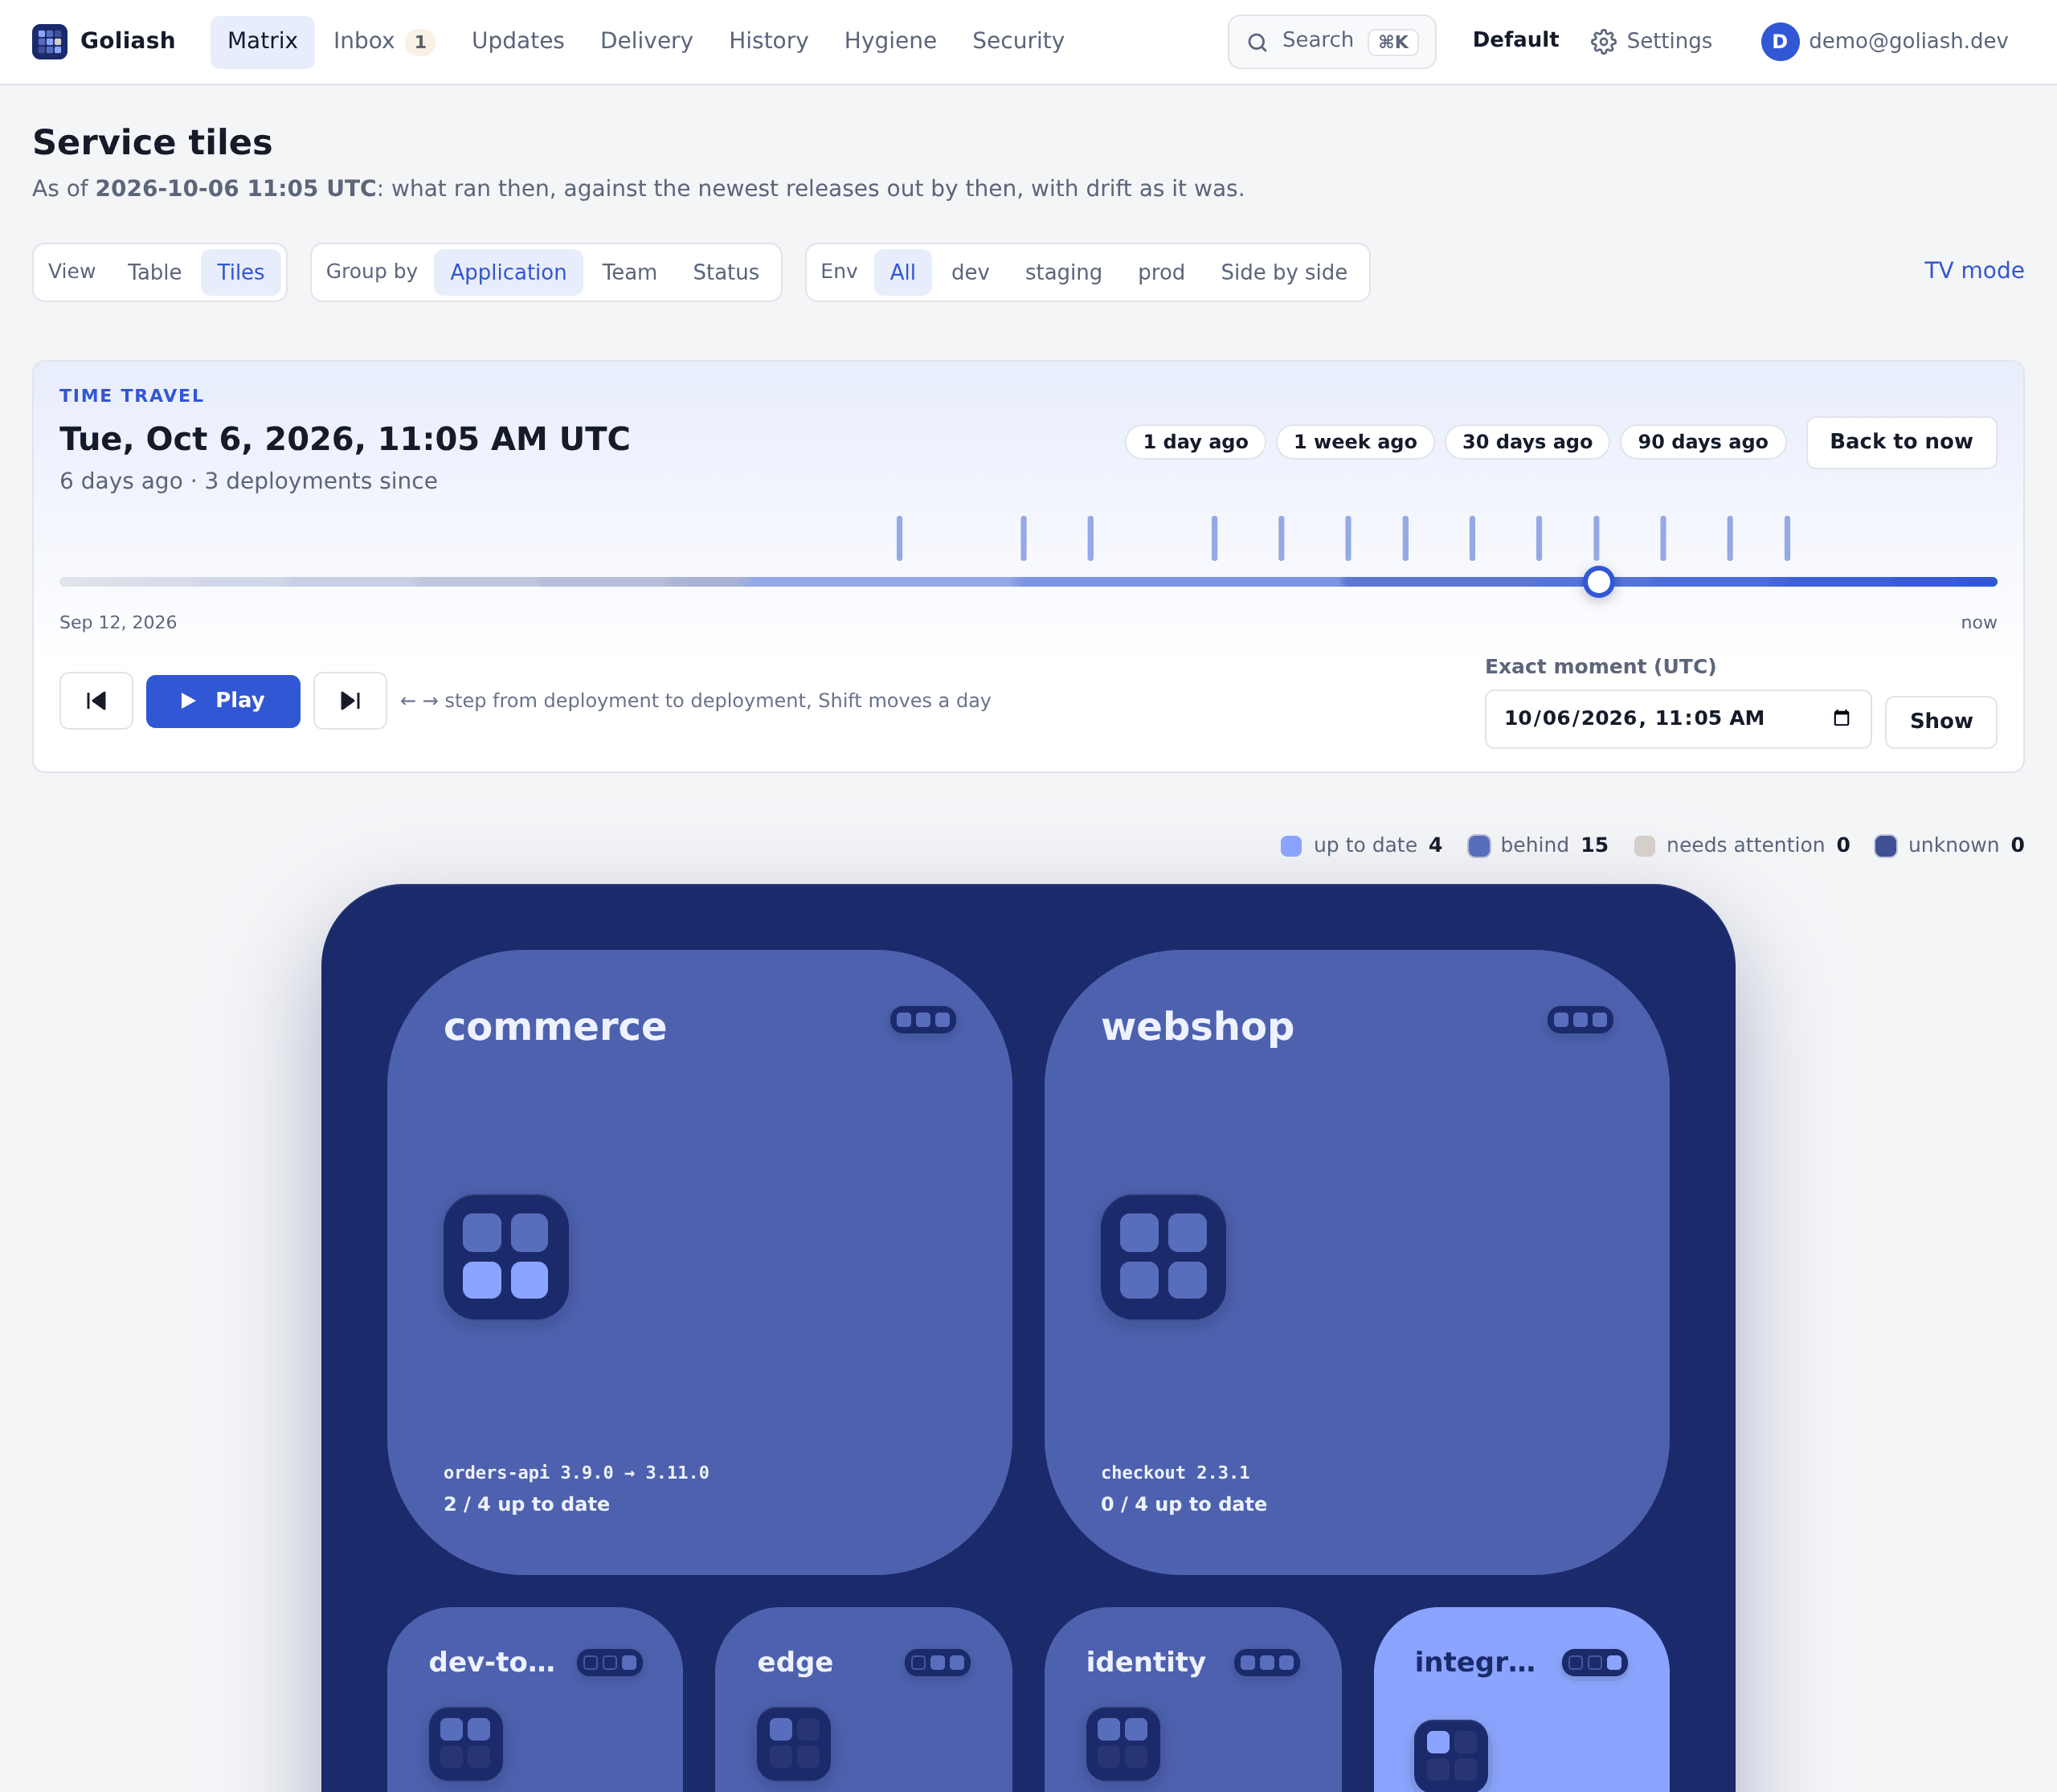
Time travel: scrub back through 400 days, step from deployment to deployment or press Play, and watch the matrix or the tiles change, coloured as things stood then. “What ran in prod when the incident started?” in seconds.
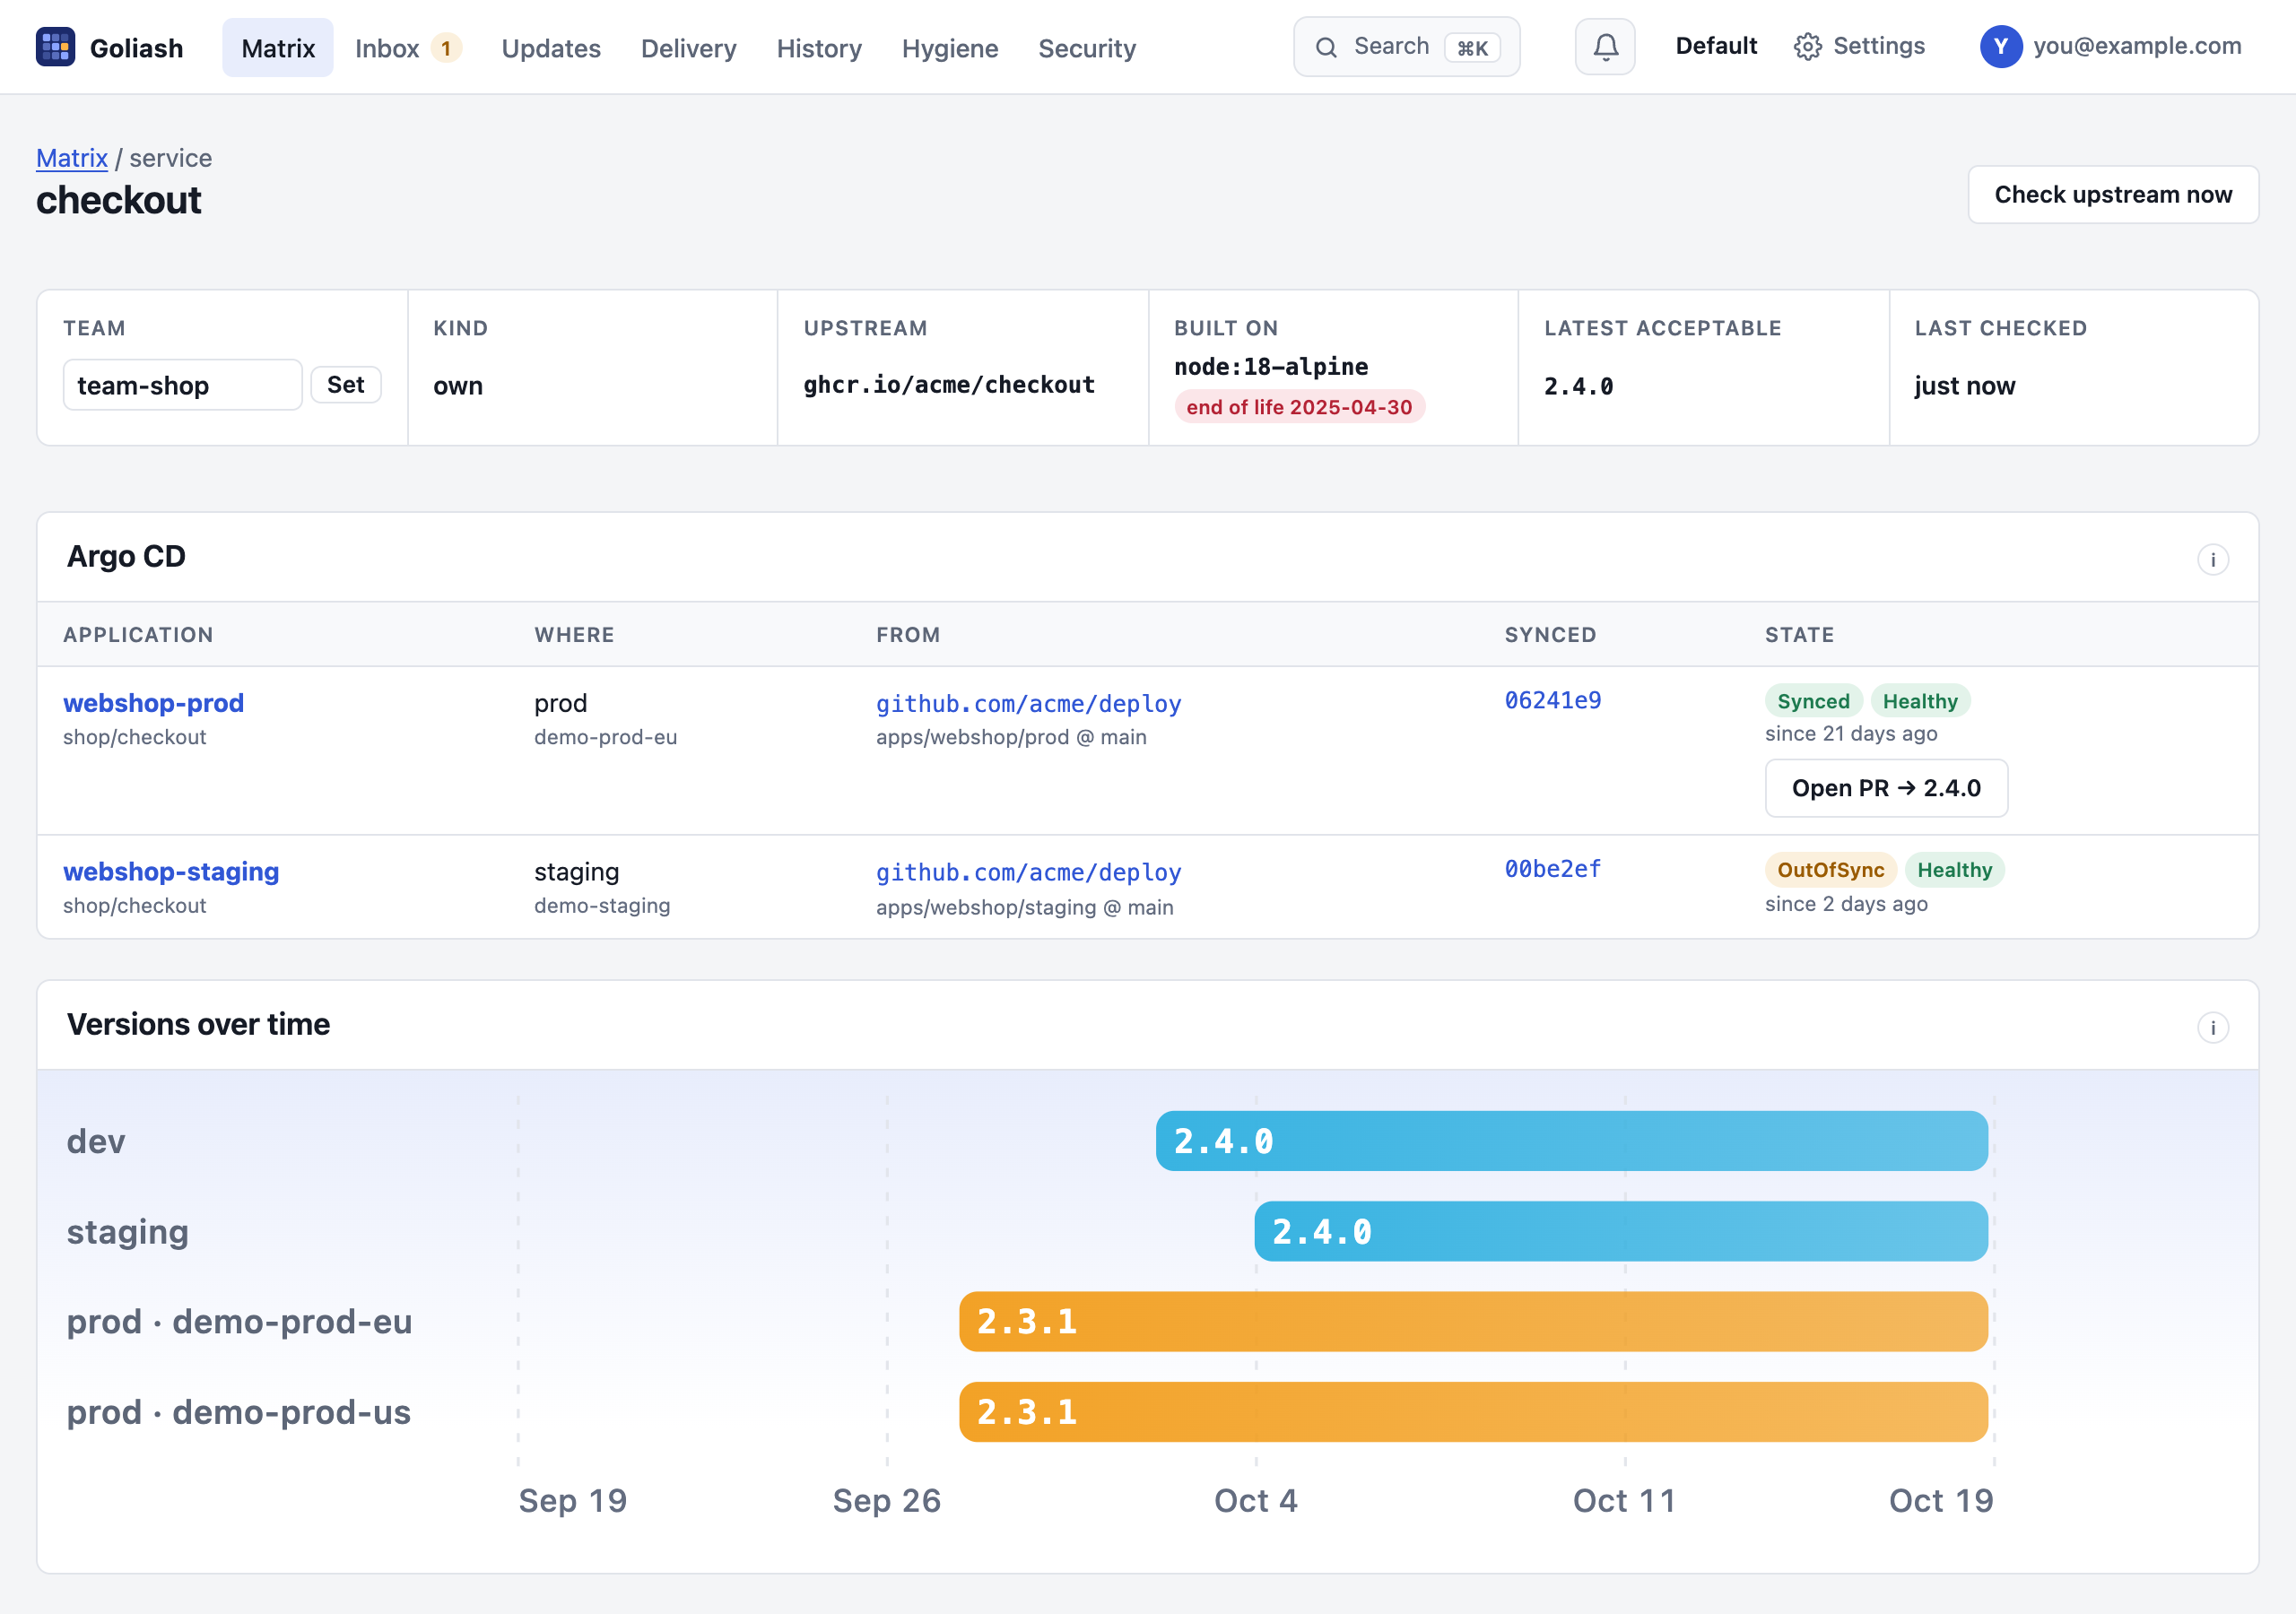
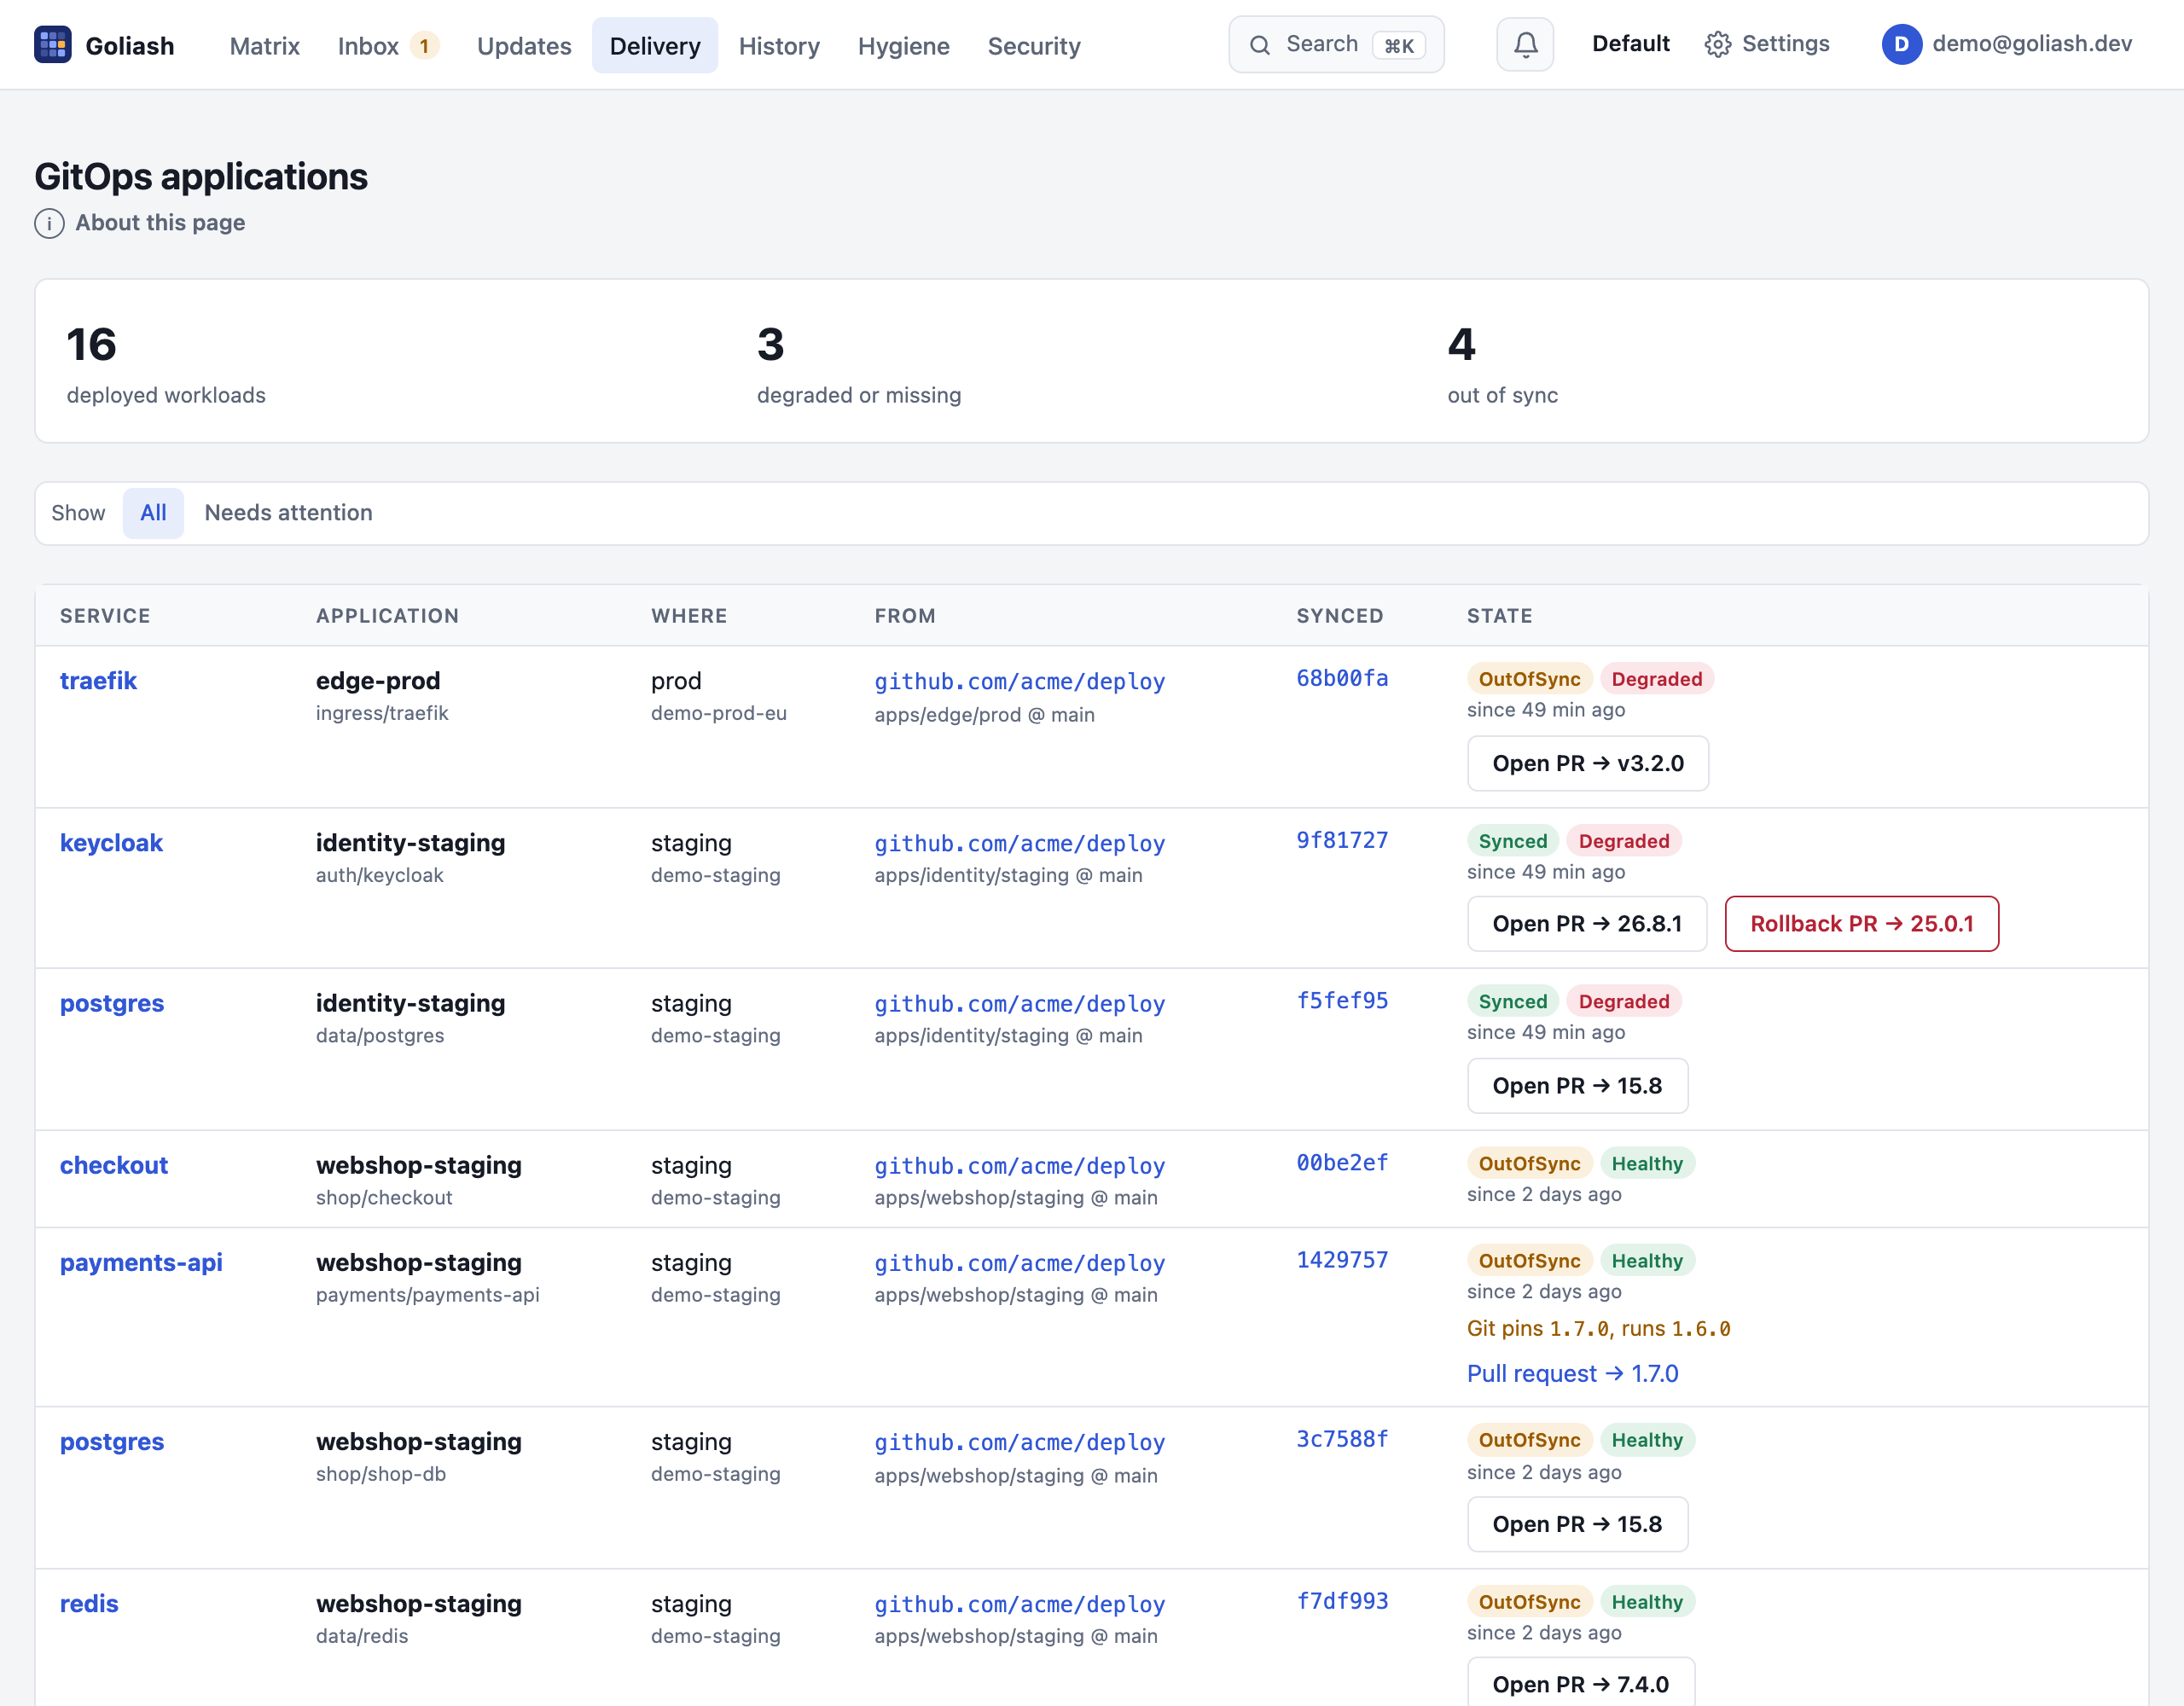
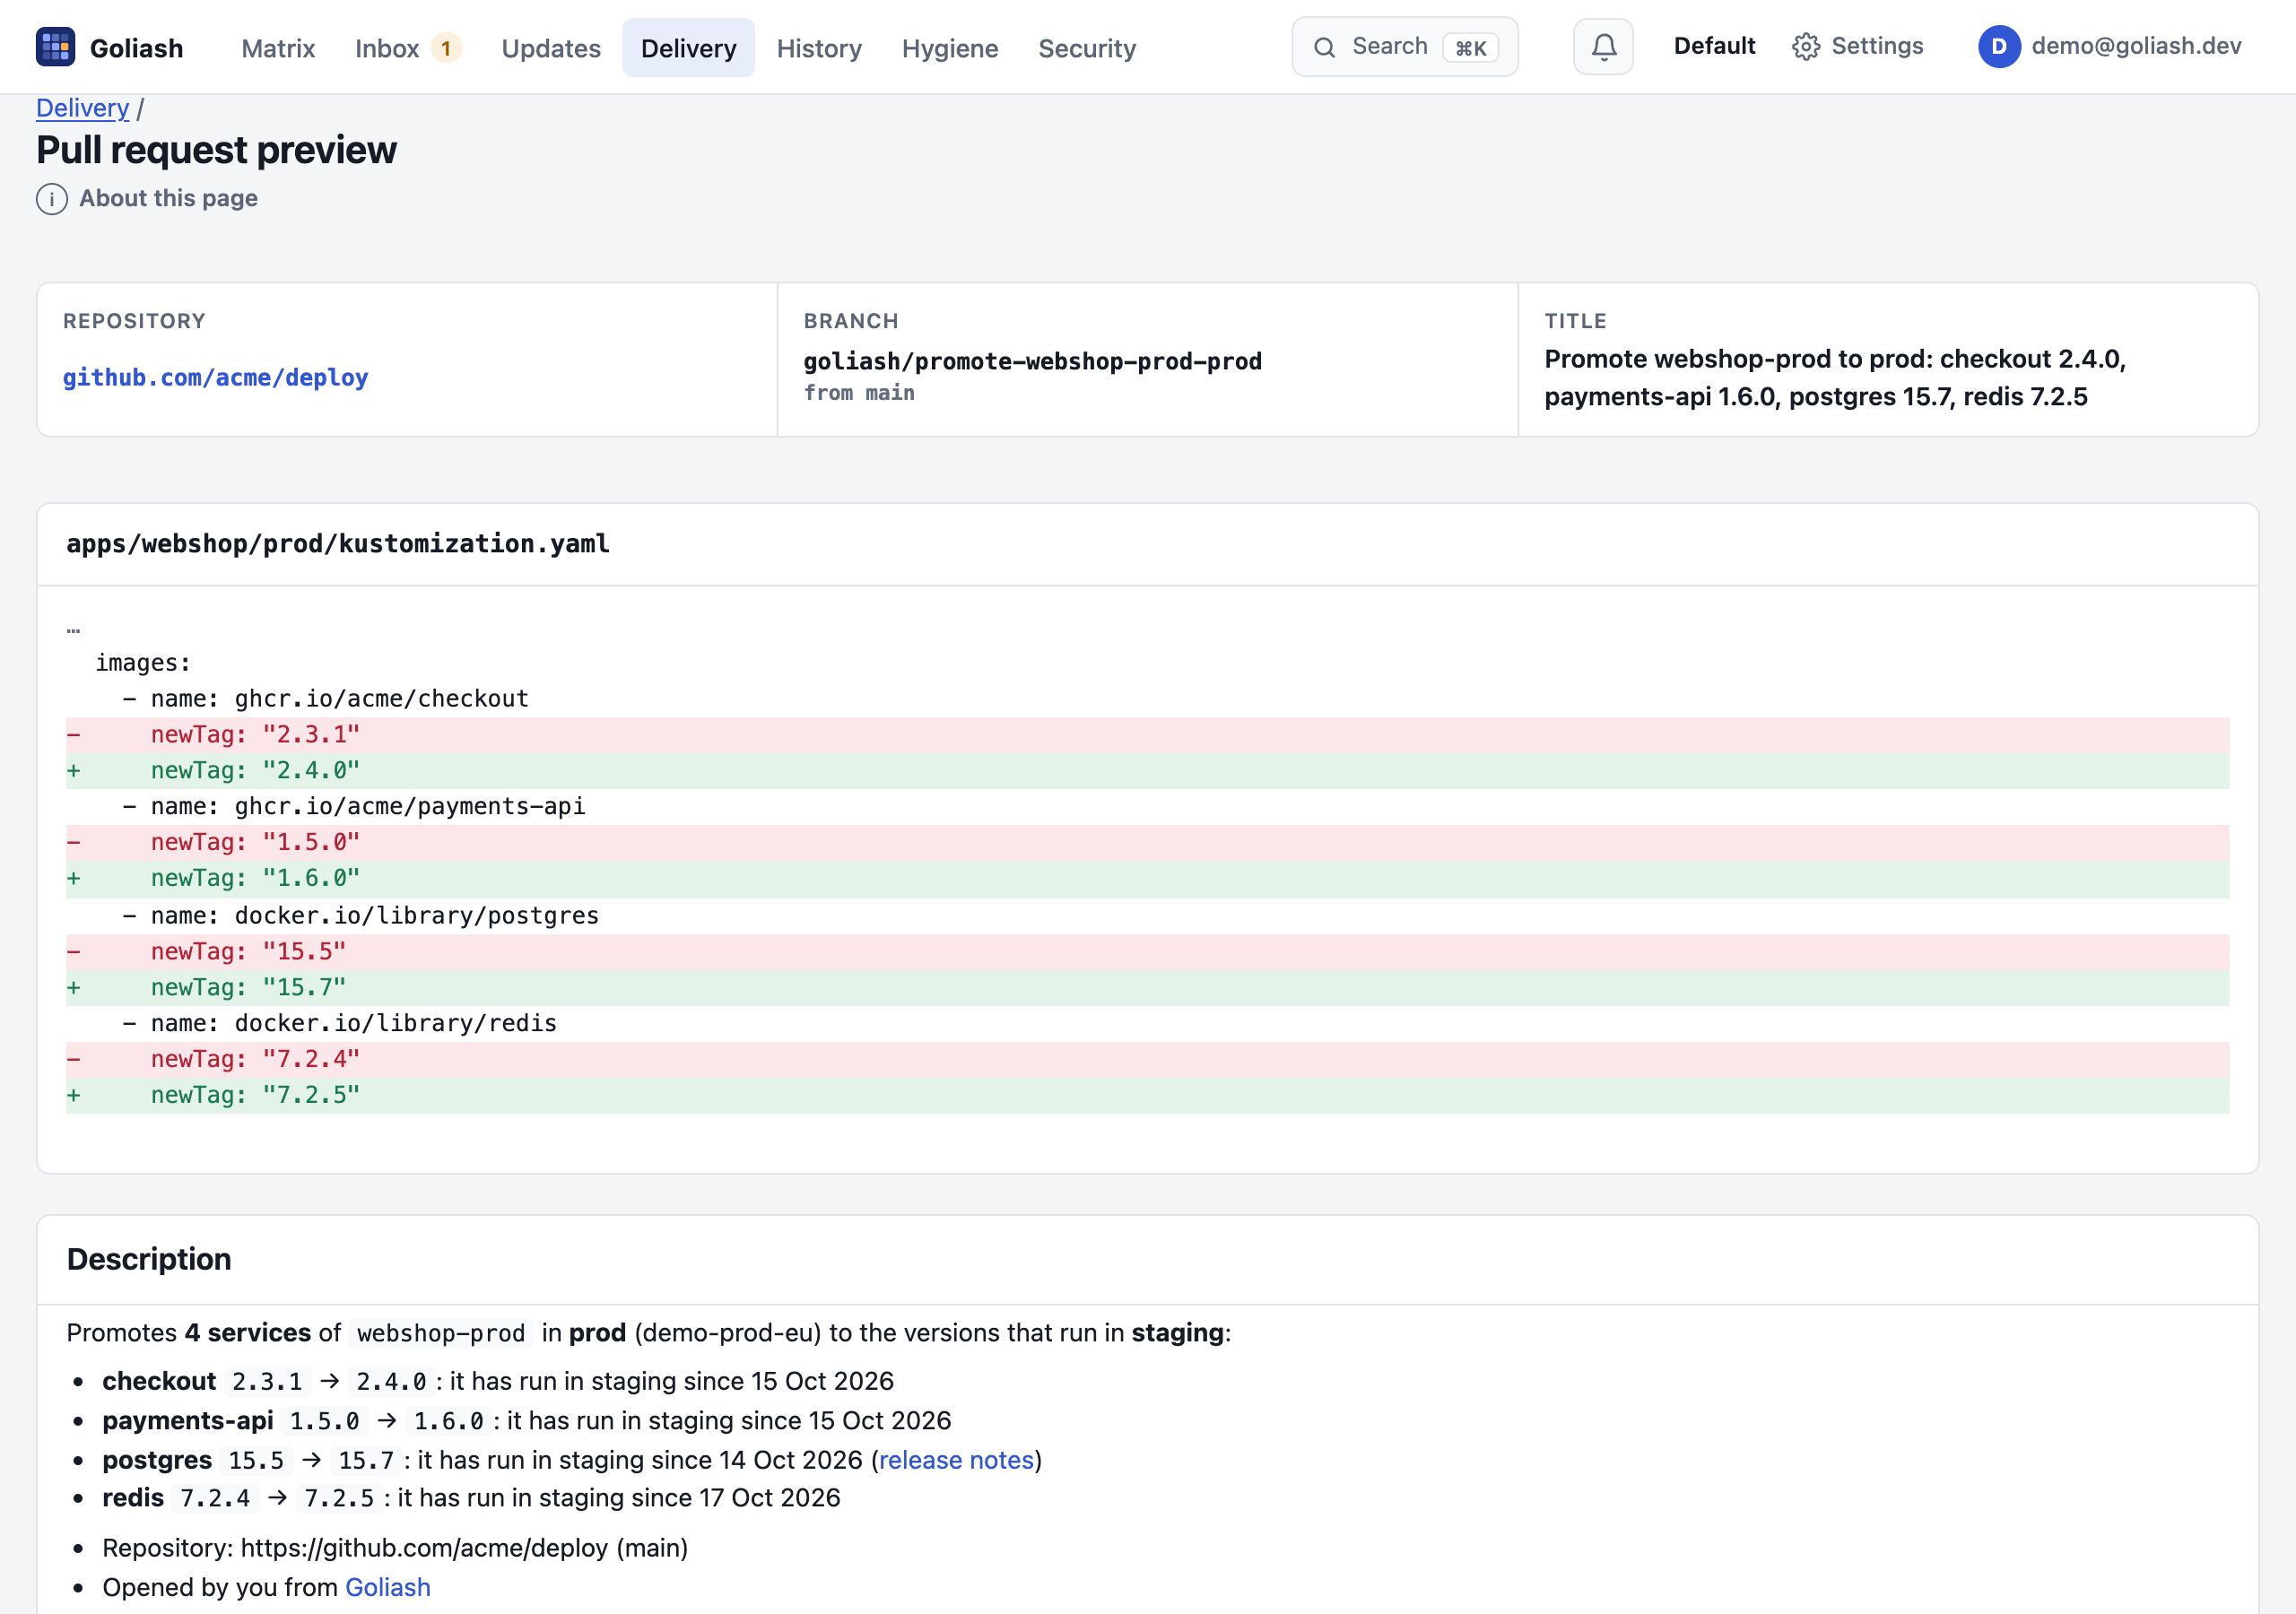
Argo CD and Flux: each service shows the Git repository, path and commit that deploy it, whether it is in sync and healthy, and what actually runs next to it. An upgrade or a promotion is one click away as a pull request on GitHub or GitLab, changing the tag where your manifests, Kustomize or Helm values pin it; you review, Argo CD or Flux deploys. Out of sync for an hour? Slack knows. How it works
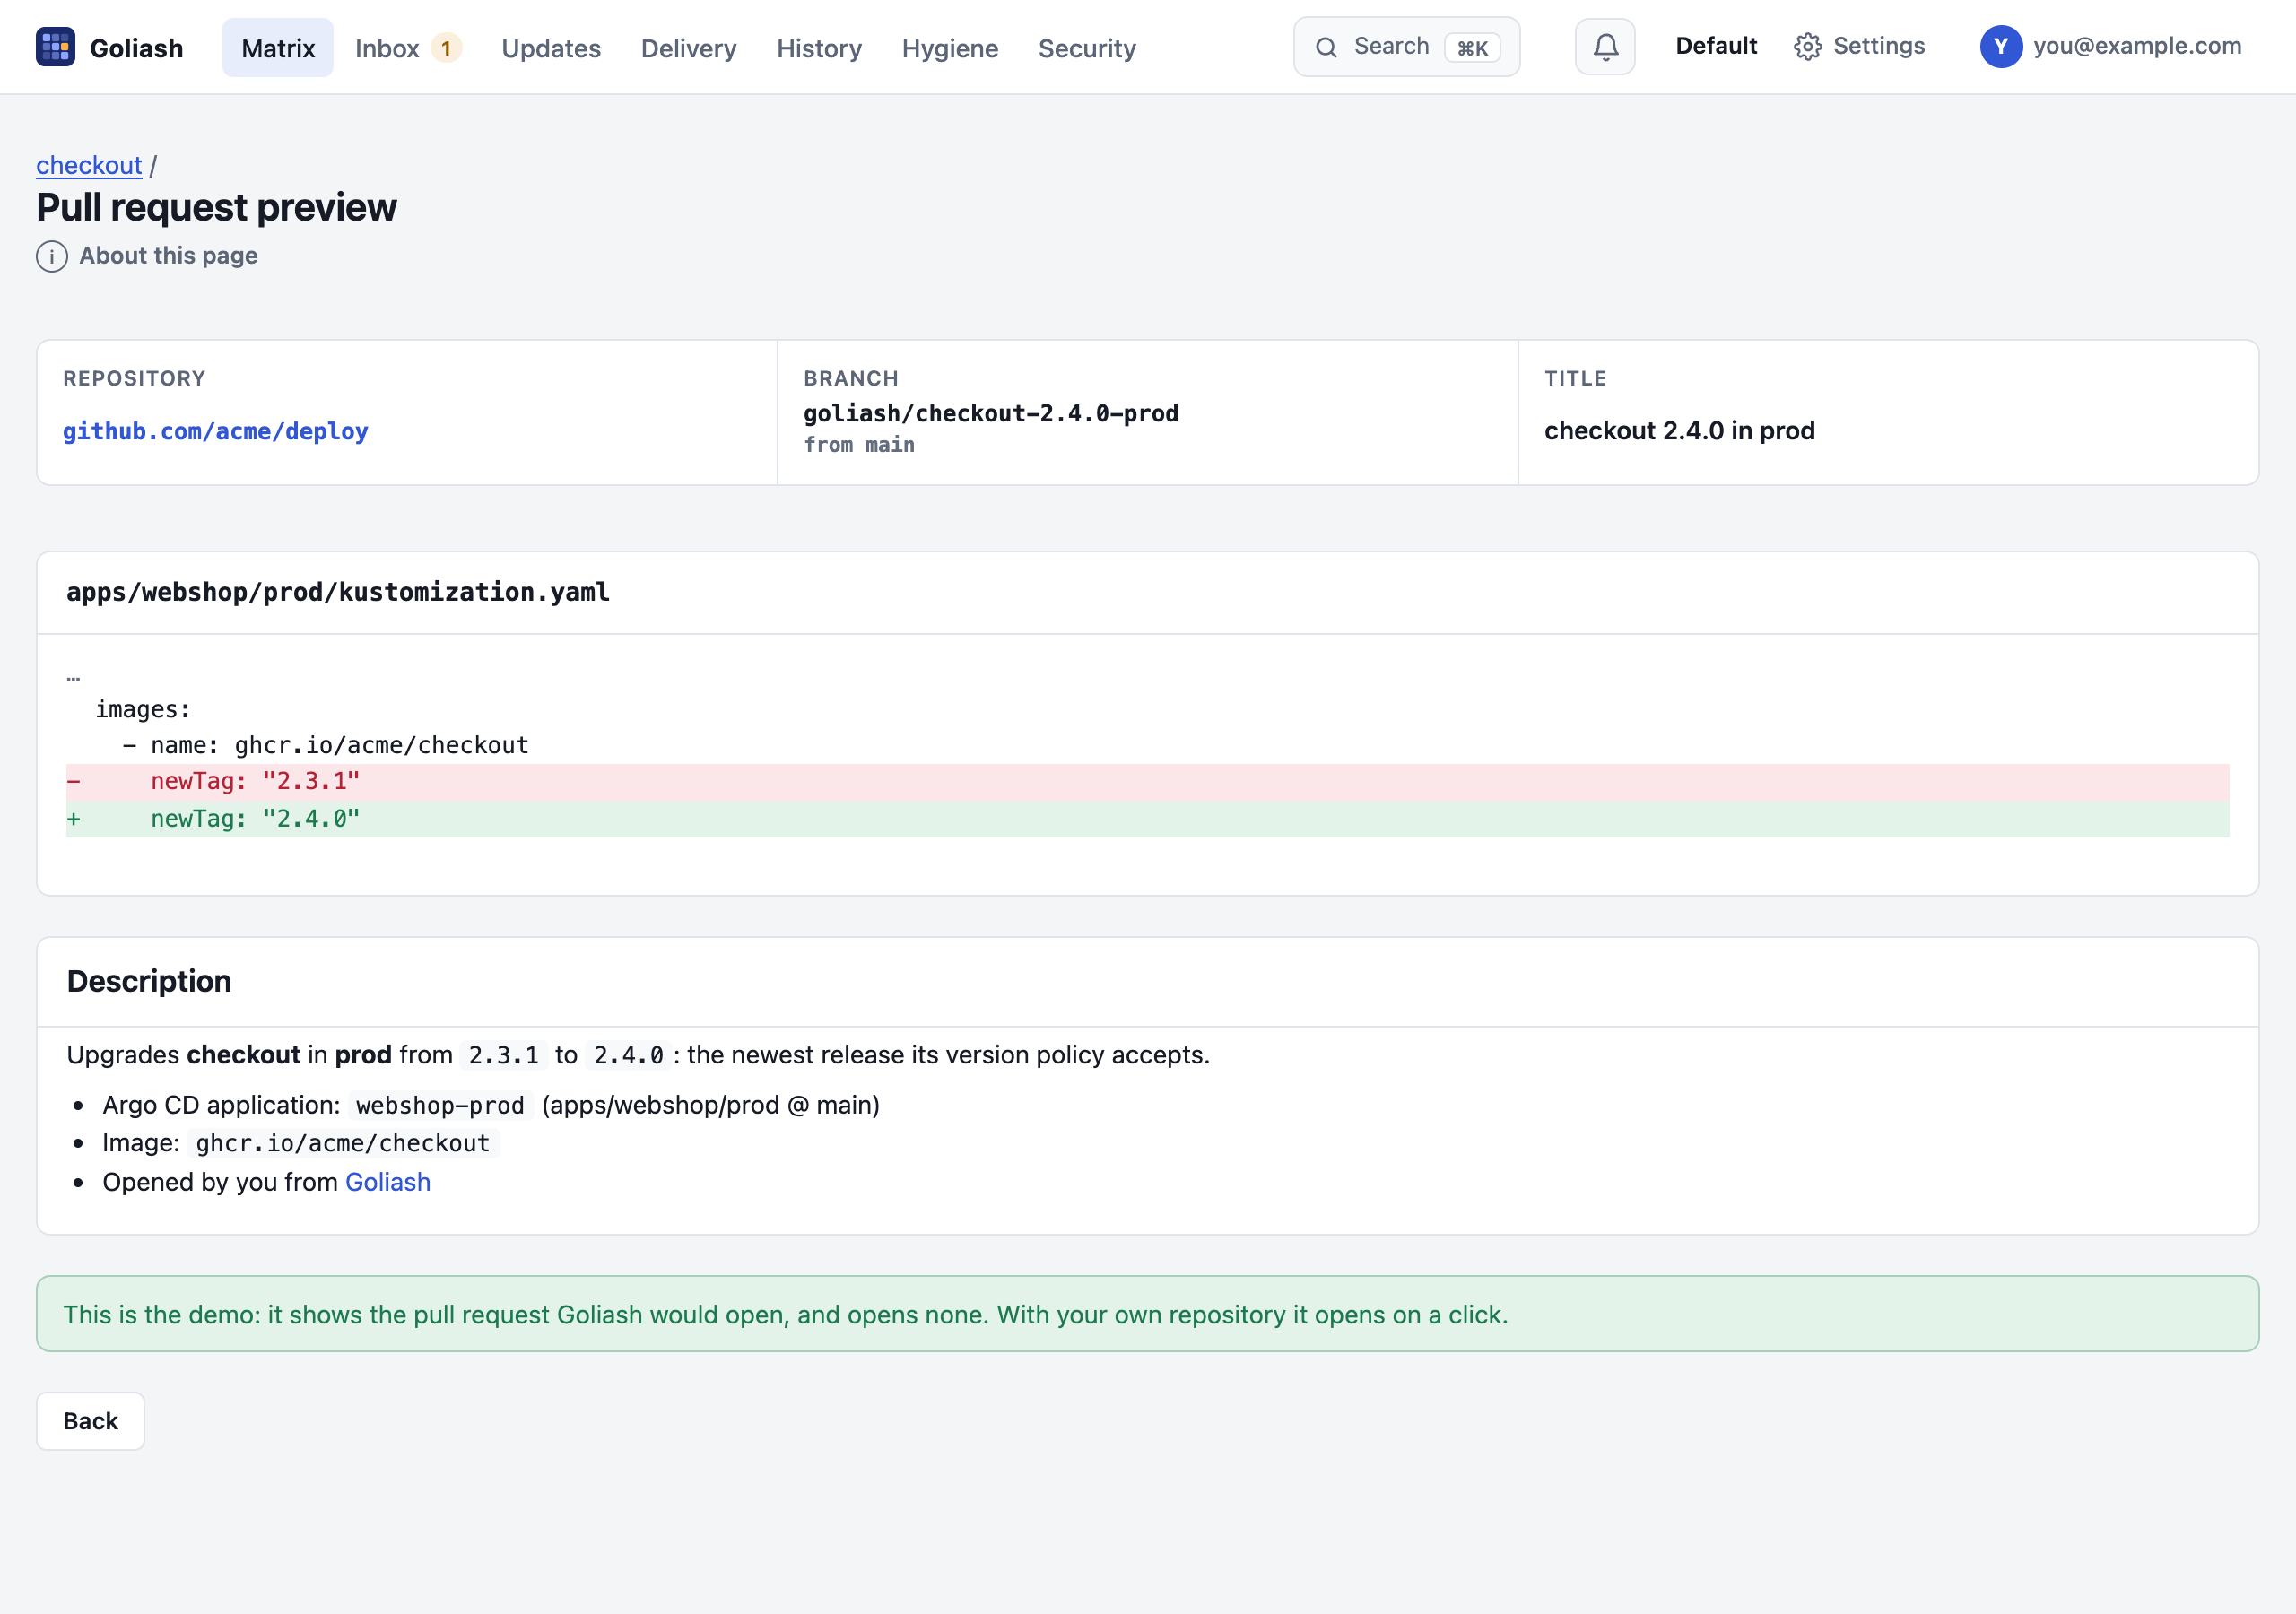
Before anything is sent, the preview shows the change line by line and the description, with the vulnerabilities the upgrade fixes. On the demo you can click it.
Goli is the assistant inside Goliash, the gentle giant with the release bell. Ask it in plain words and it looks things up for you, live, as you:
What should we upgrade first, and why?
payments-api in prod: it runs log4j-core 2.14.1, exploited in the wild; 2.16.0 fixes it. Then postgres 15, end of life in a month…
Every upgrade on the Updates page has a Brief button. Goli reads the release notes of every release between what runs and the target, straight from the project’s GitHub or GitLab releases, and turns them into a checklist: breaking changes and migrations first, then what it fixes (security first), then what to check before and after. Keycloak 24 → 26 is three major versions of release notes; Goli reads them in half a minute and starts with what will stop your login page from working.
It never calls an upgrade safe, and it says so when the notes are silent: the decision stays yours. Try it on the live demo.
Build-time SBOMs say what an image contains. Goliash says which of those images run, where, and since when: one CycloneDX 1.6 document with every running image, its digest, the environment, cluster and service it runs in, and the packages of its SBOM nested inside. Export it from the matrix or the Security page, for one environment or a moment in the past, or let Dependency-Track track one project per environment:
curl -H "Authorization: Bearer $GOLIASH_TOKEN" \ "https://goliash.example.com/api/v1/inventory?format=cyclonedx&environment=prod" \ | curl -X POST "$DTRACK/api/v1/bom" -H "X-Api-Key: $DTRACK_API_KEY" \ -F autoCreate=true -F projectName="goliash prod" -F projectVersion=running -F bom=@-The software inventory the Cyber Resilience Act, NIS2 and your customers’ questionnaires ask for, kept current by the runtime itself. How it works →
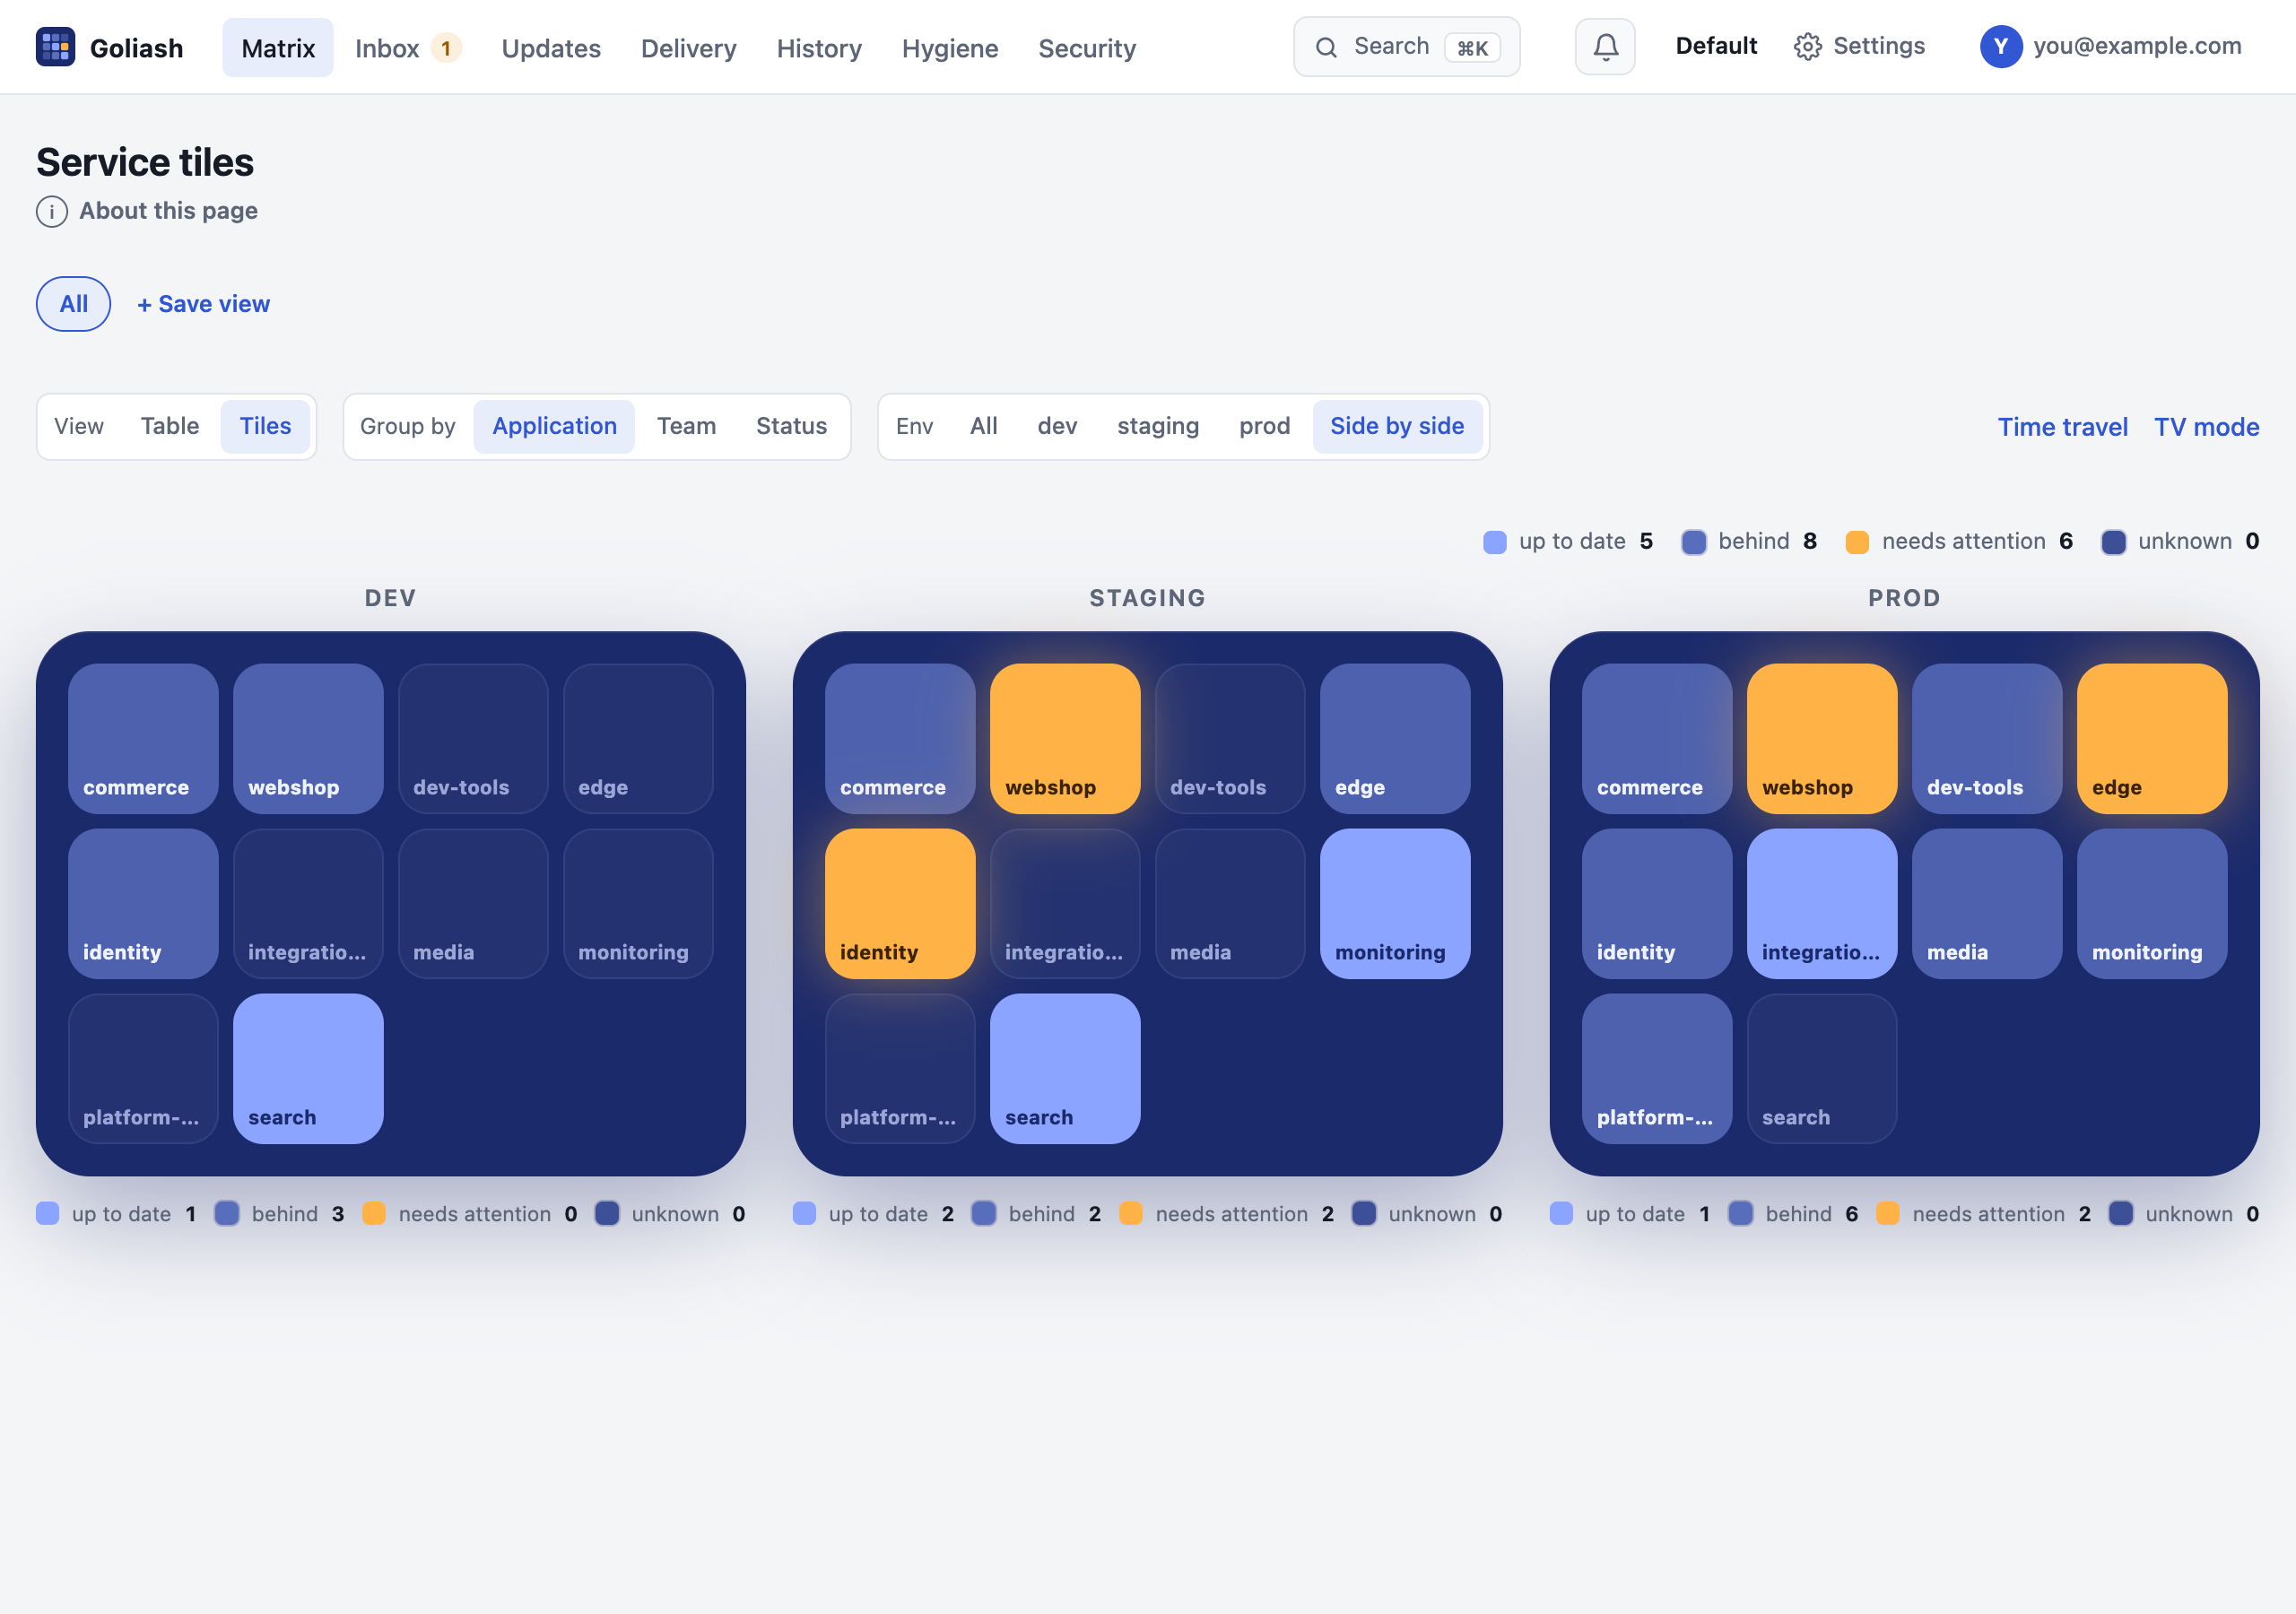
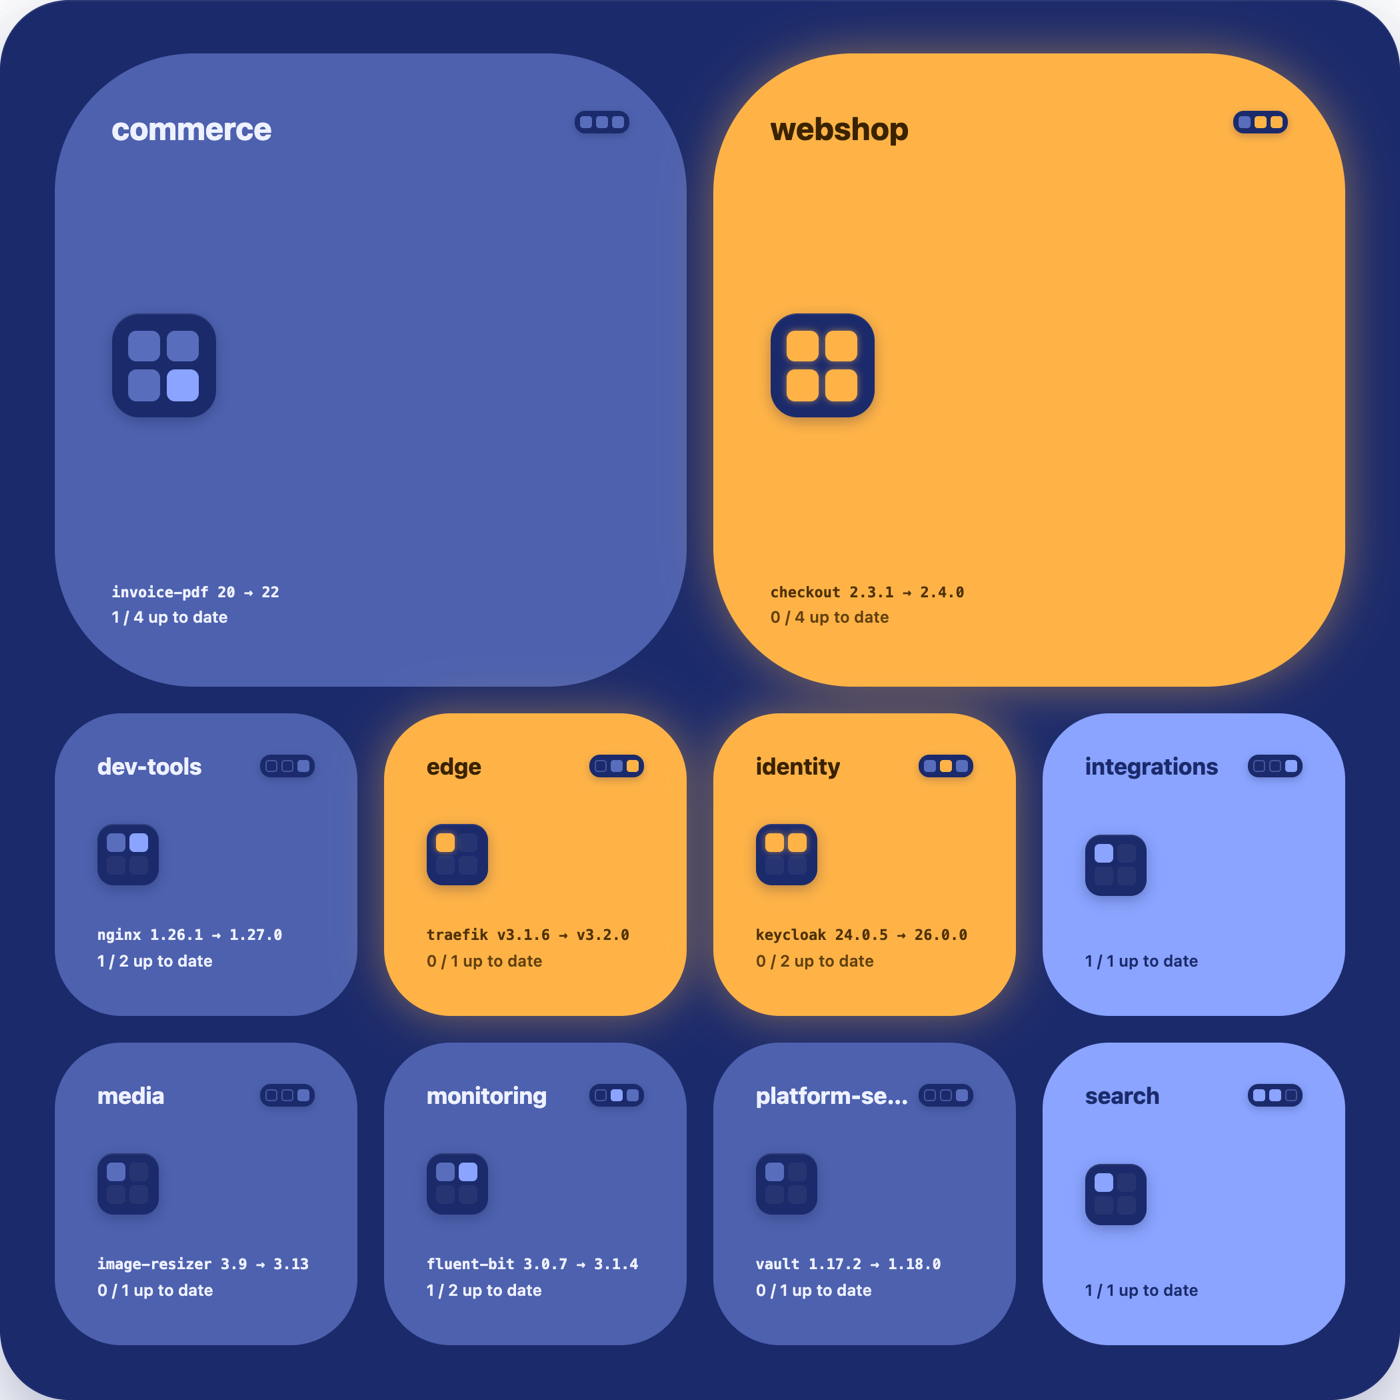
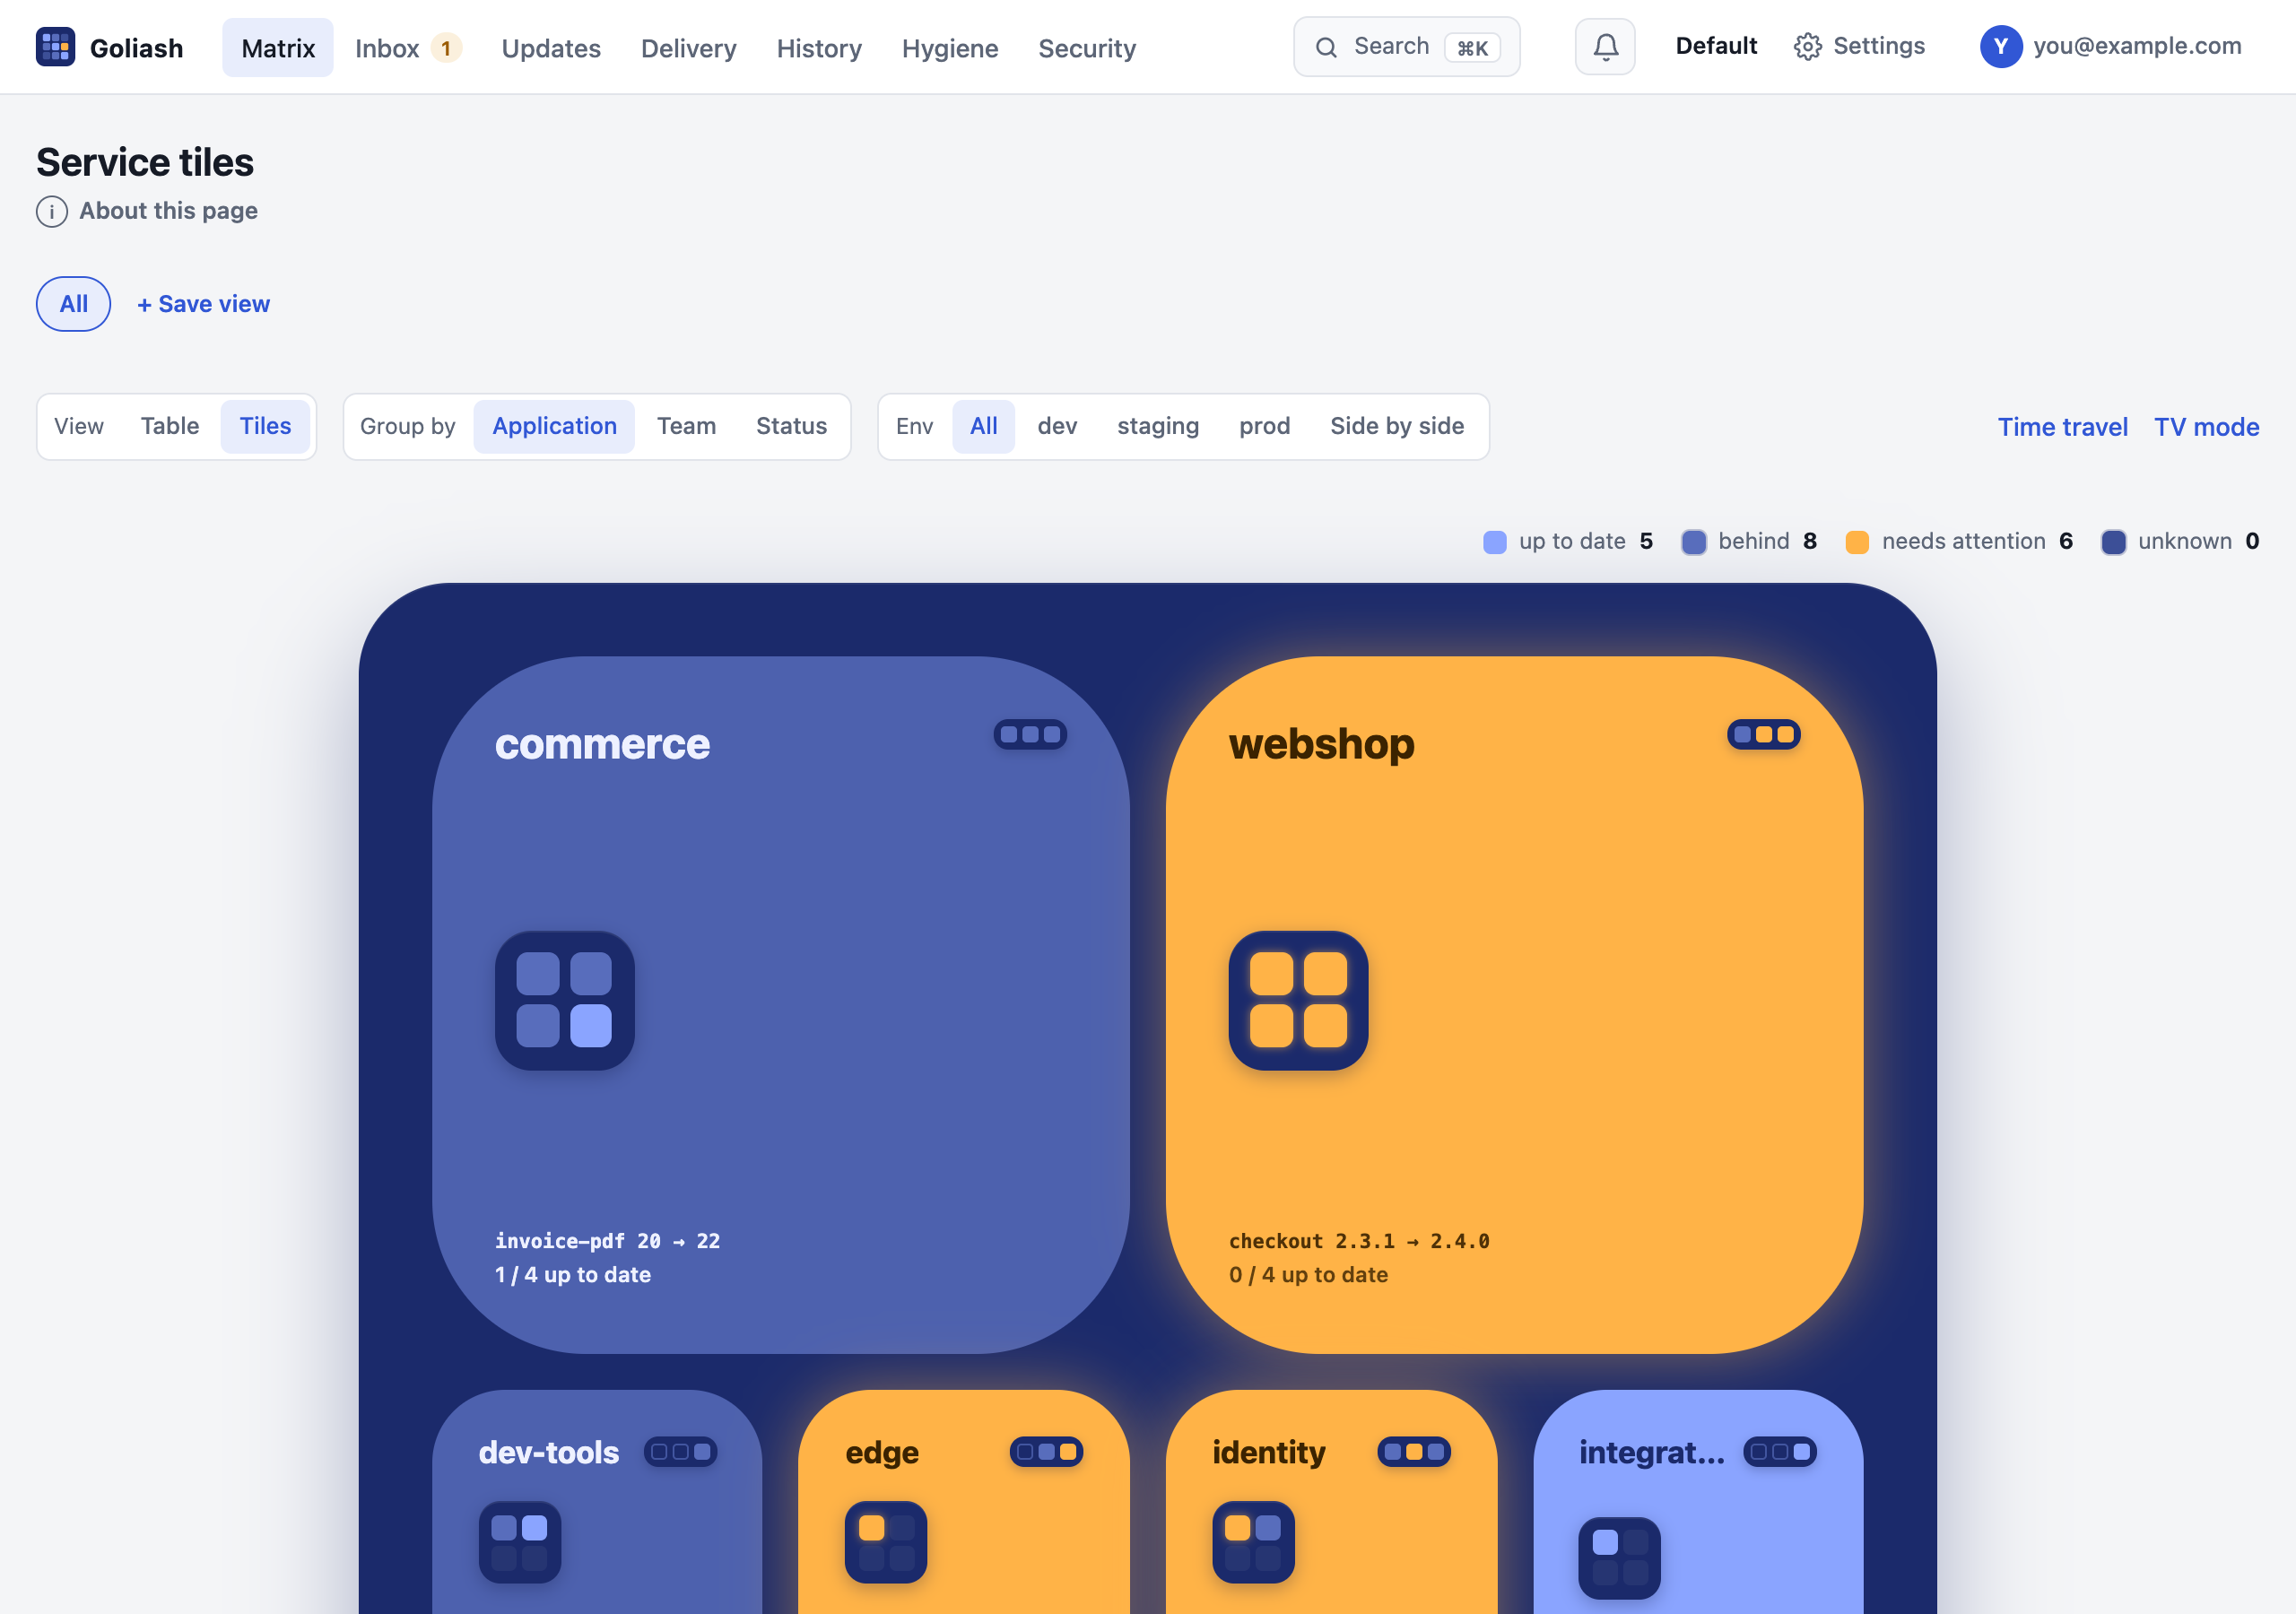
Tiles draw your estate like the logo: every application a cell, warm where something needs attention, one board per environment side by side. Open a cell for its services; put it on a wall screen in TV mode.
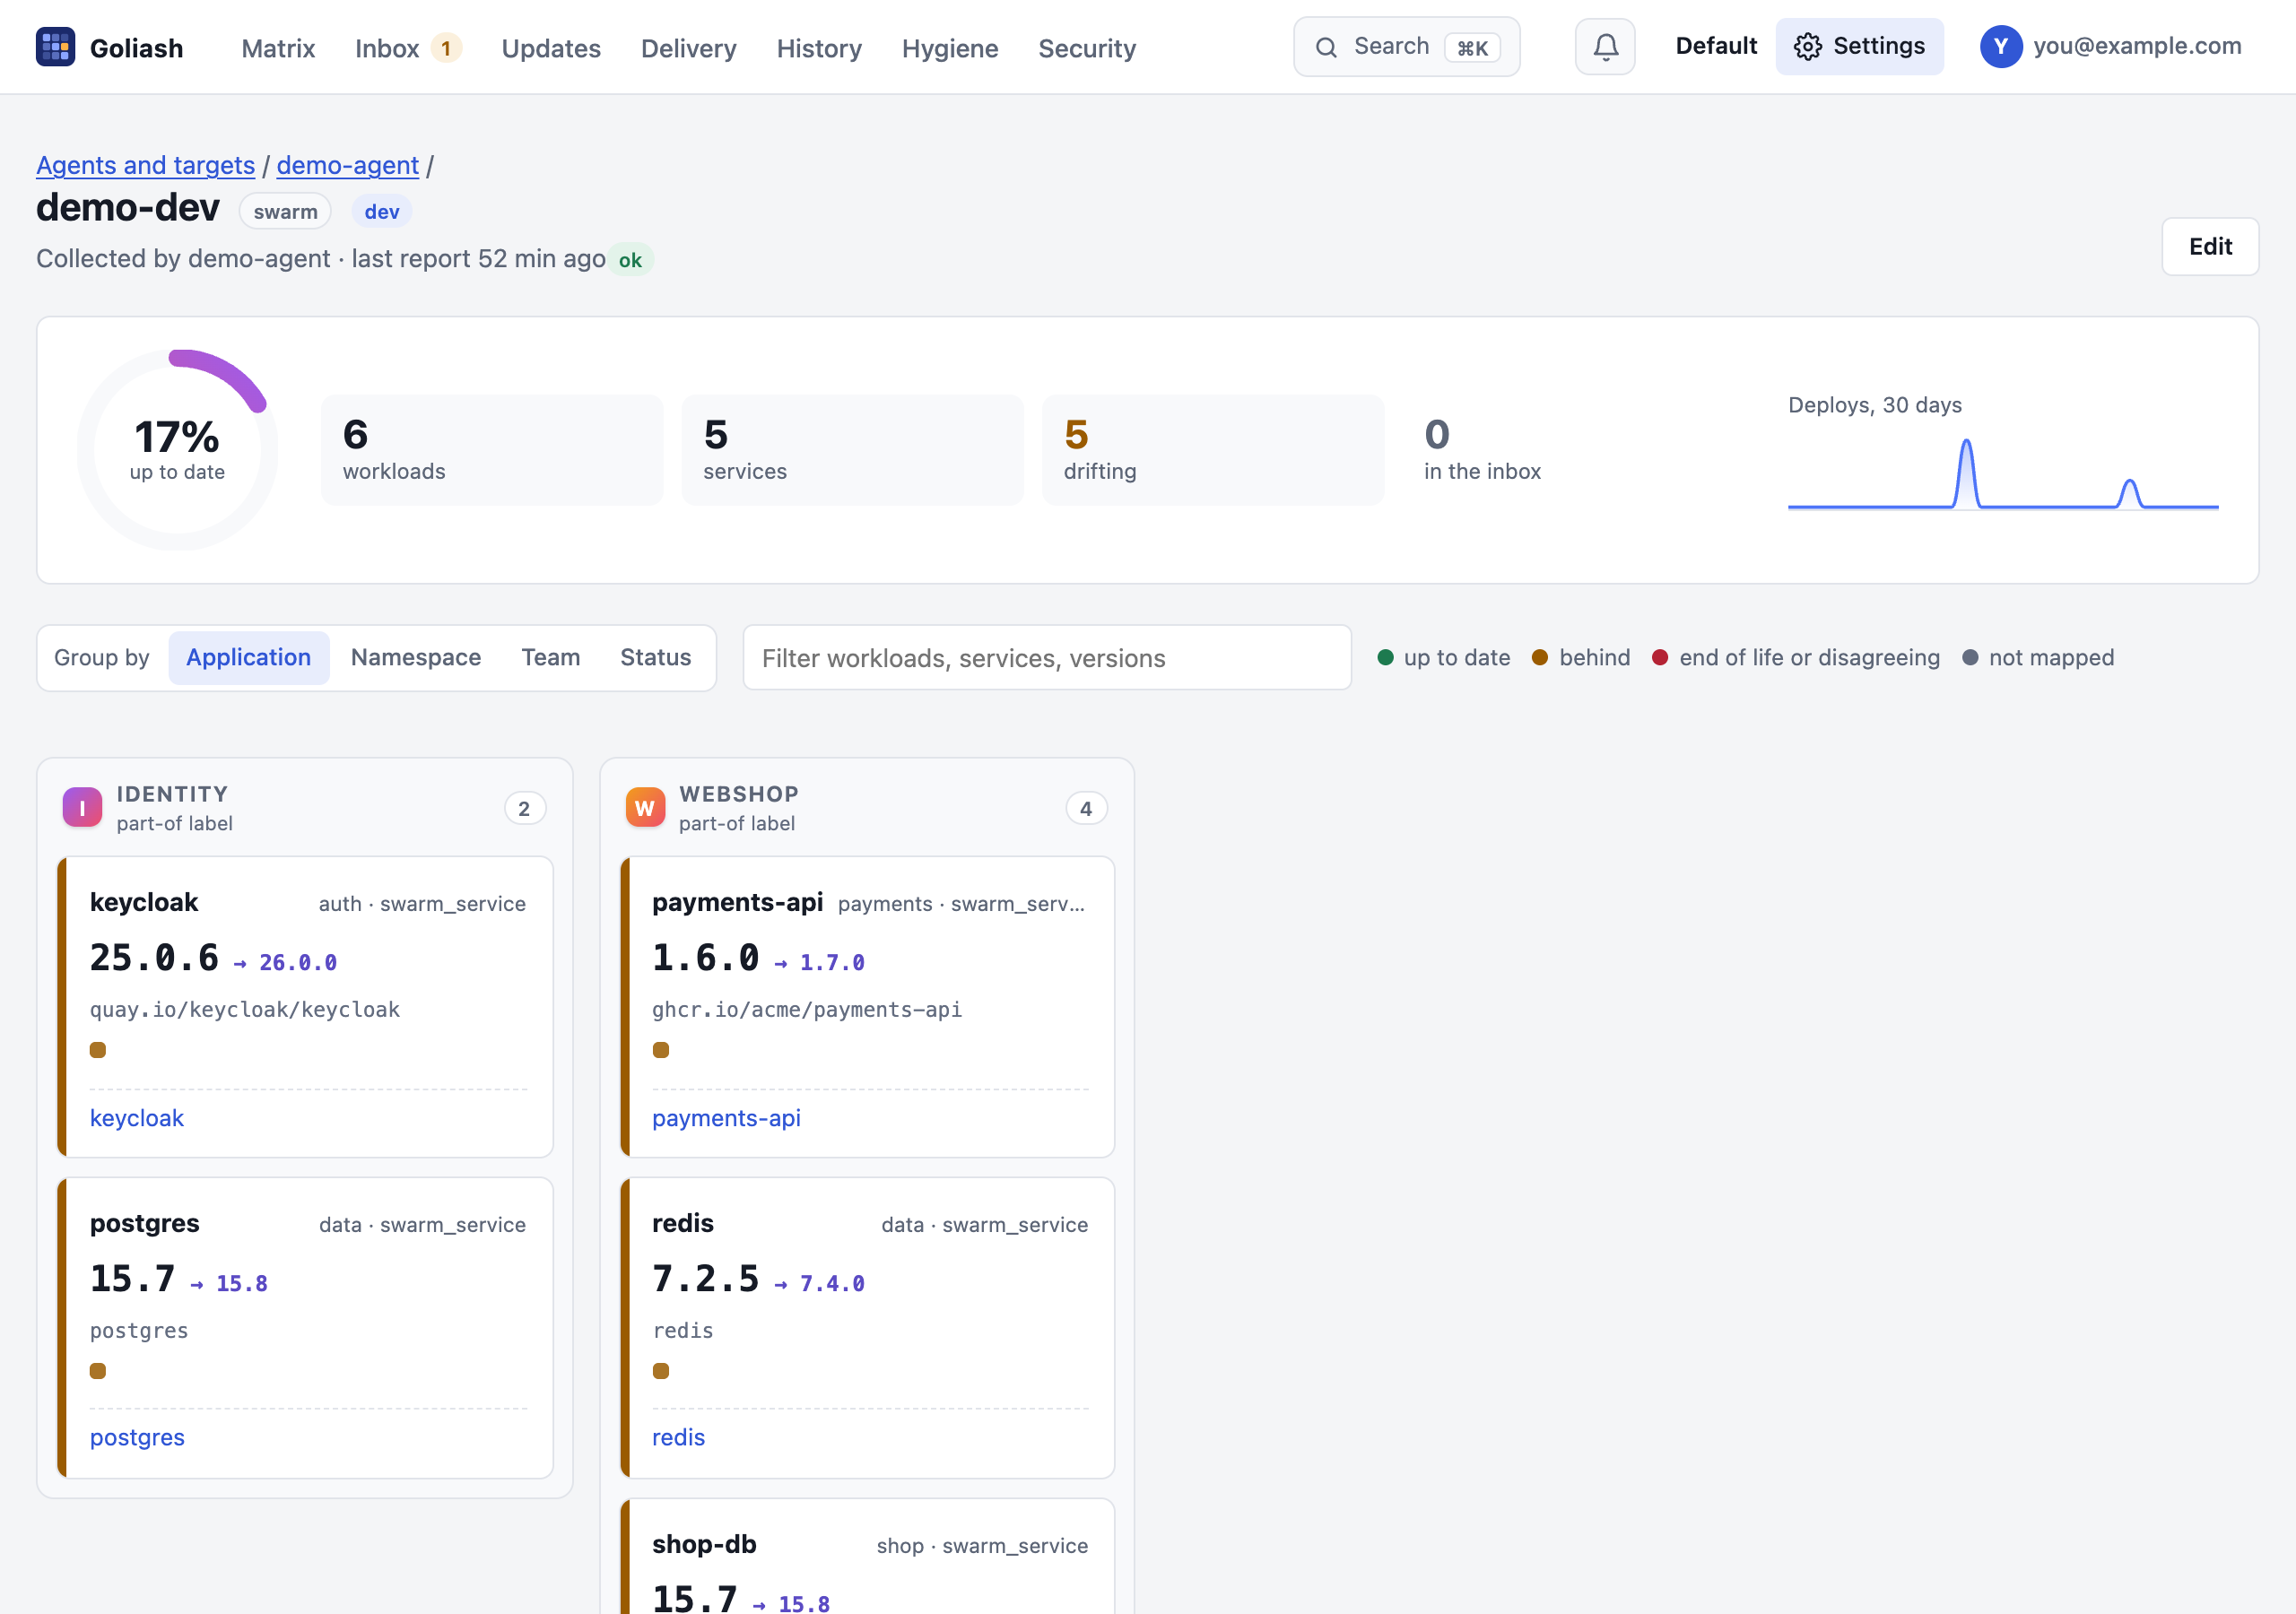
Every target at a glance: the share of workloads that are current, deploys over time, and every workload as a card, grouped by application.
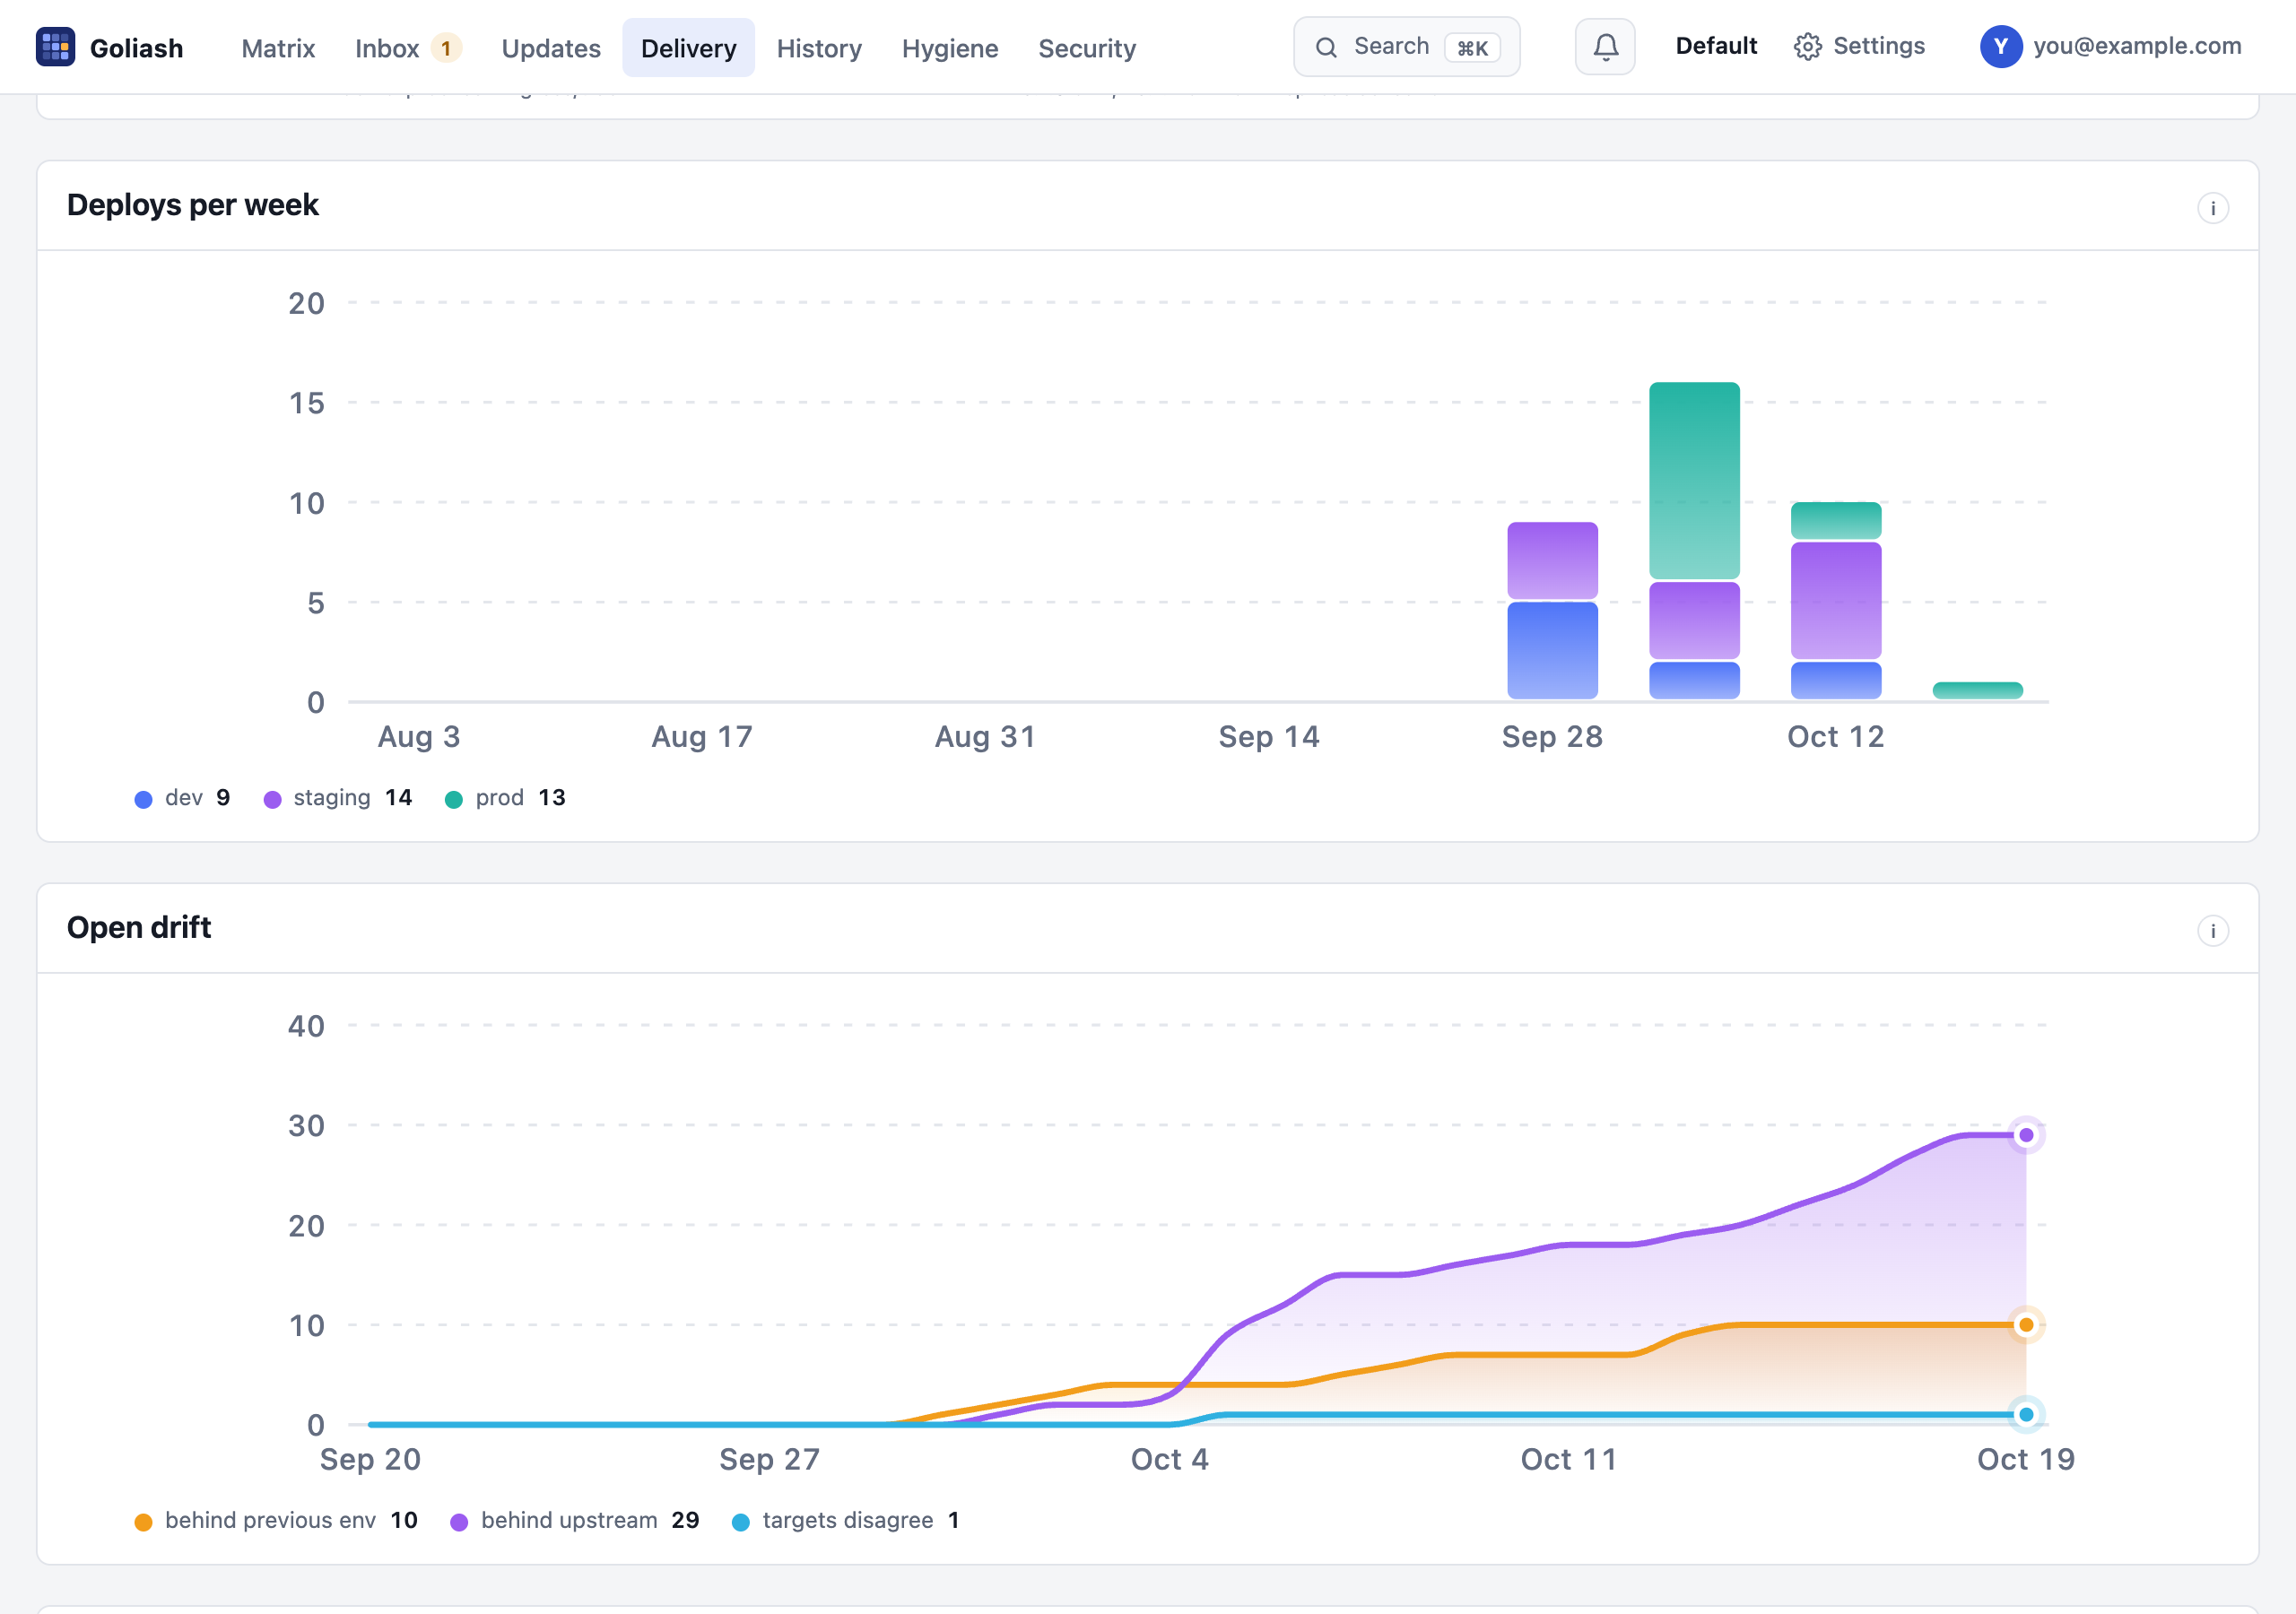
Delivery: deploys per week, open drift per day, and what waits to be promoted.
your network Goliash server┌─────────────────────────────────┐ ┌──────────────────────────────────┐│ Kubernetes / ECS / Nomad / │ │ ingest → mapping → versions ││ Swarm / Docker ─read-only─► agent ─HTTPS────► │ │ │ ││ private registries ──► agent │ snapshots │ ▼ ▼ │└─────────────────────────────────┘ │ events, matrix notifier ──► Slack, webhook, e-mail │ UI, REST API SQLite / Postgres│ └──────────────────────────────────┘The agent runs next to what it watches and sends full snapshots, so an outage loses nothing. The server turns snapshots into history, maps containers to services, compares them with upstream releases and notifies you. It can also collect what it reaches itself, without an agent.