
Notifications
Notifications have two parts: channels (where messages go) and rules (which events go there, and how often). Both are managed on the Notifications page or with the CLI.
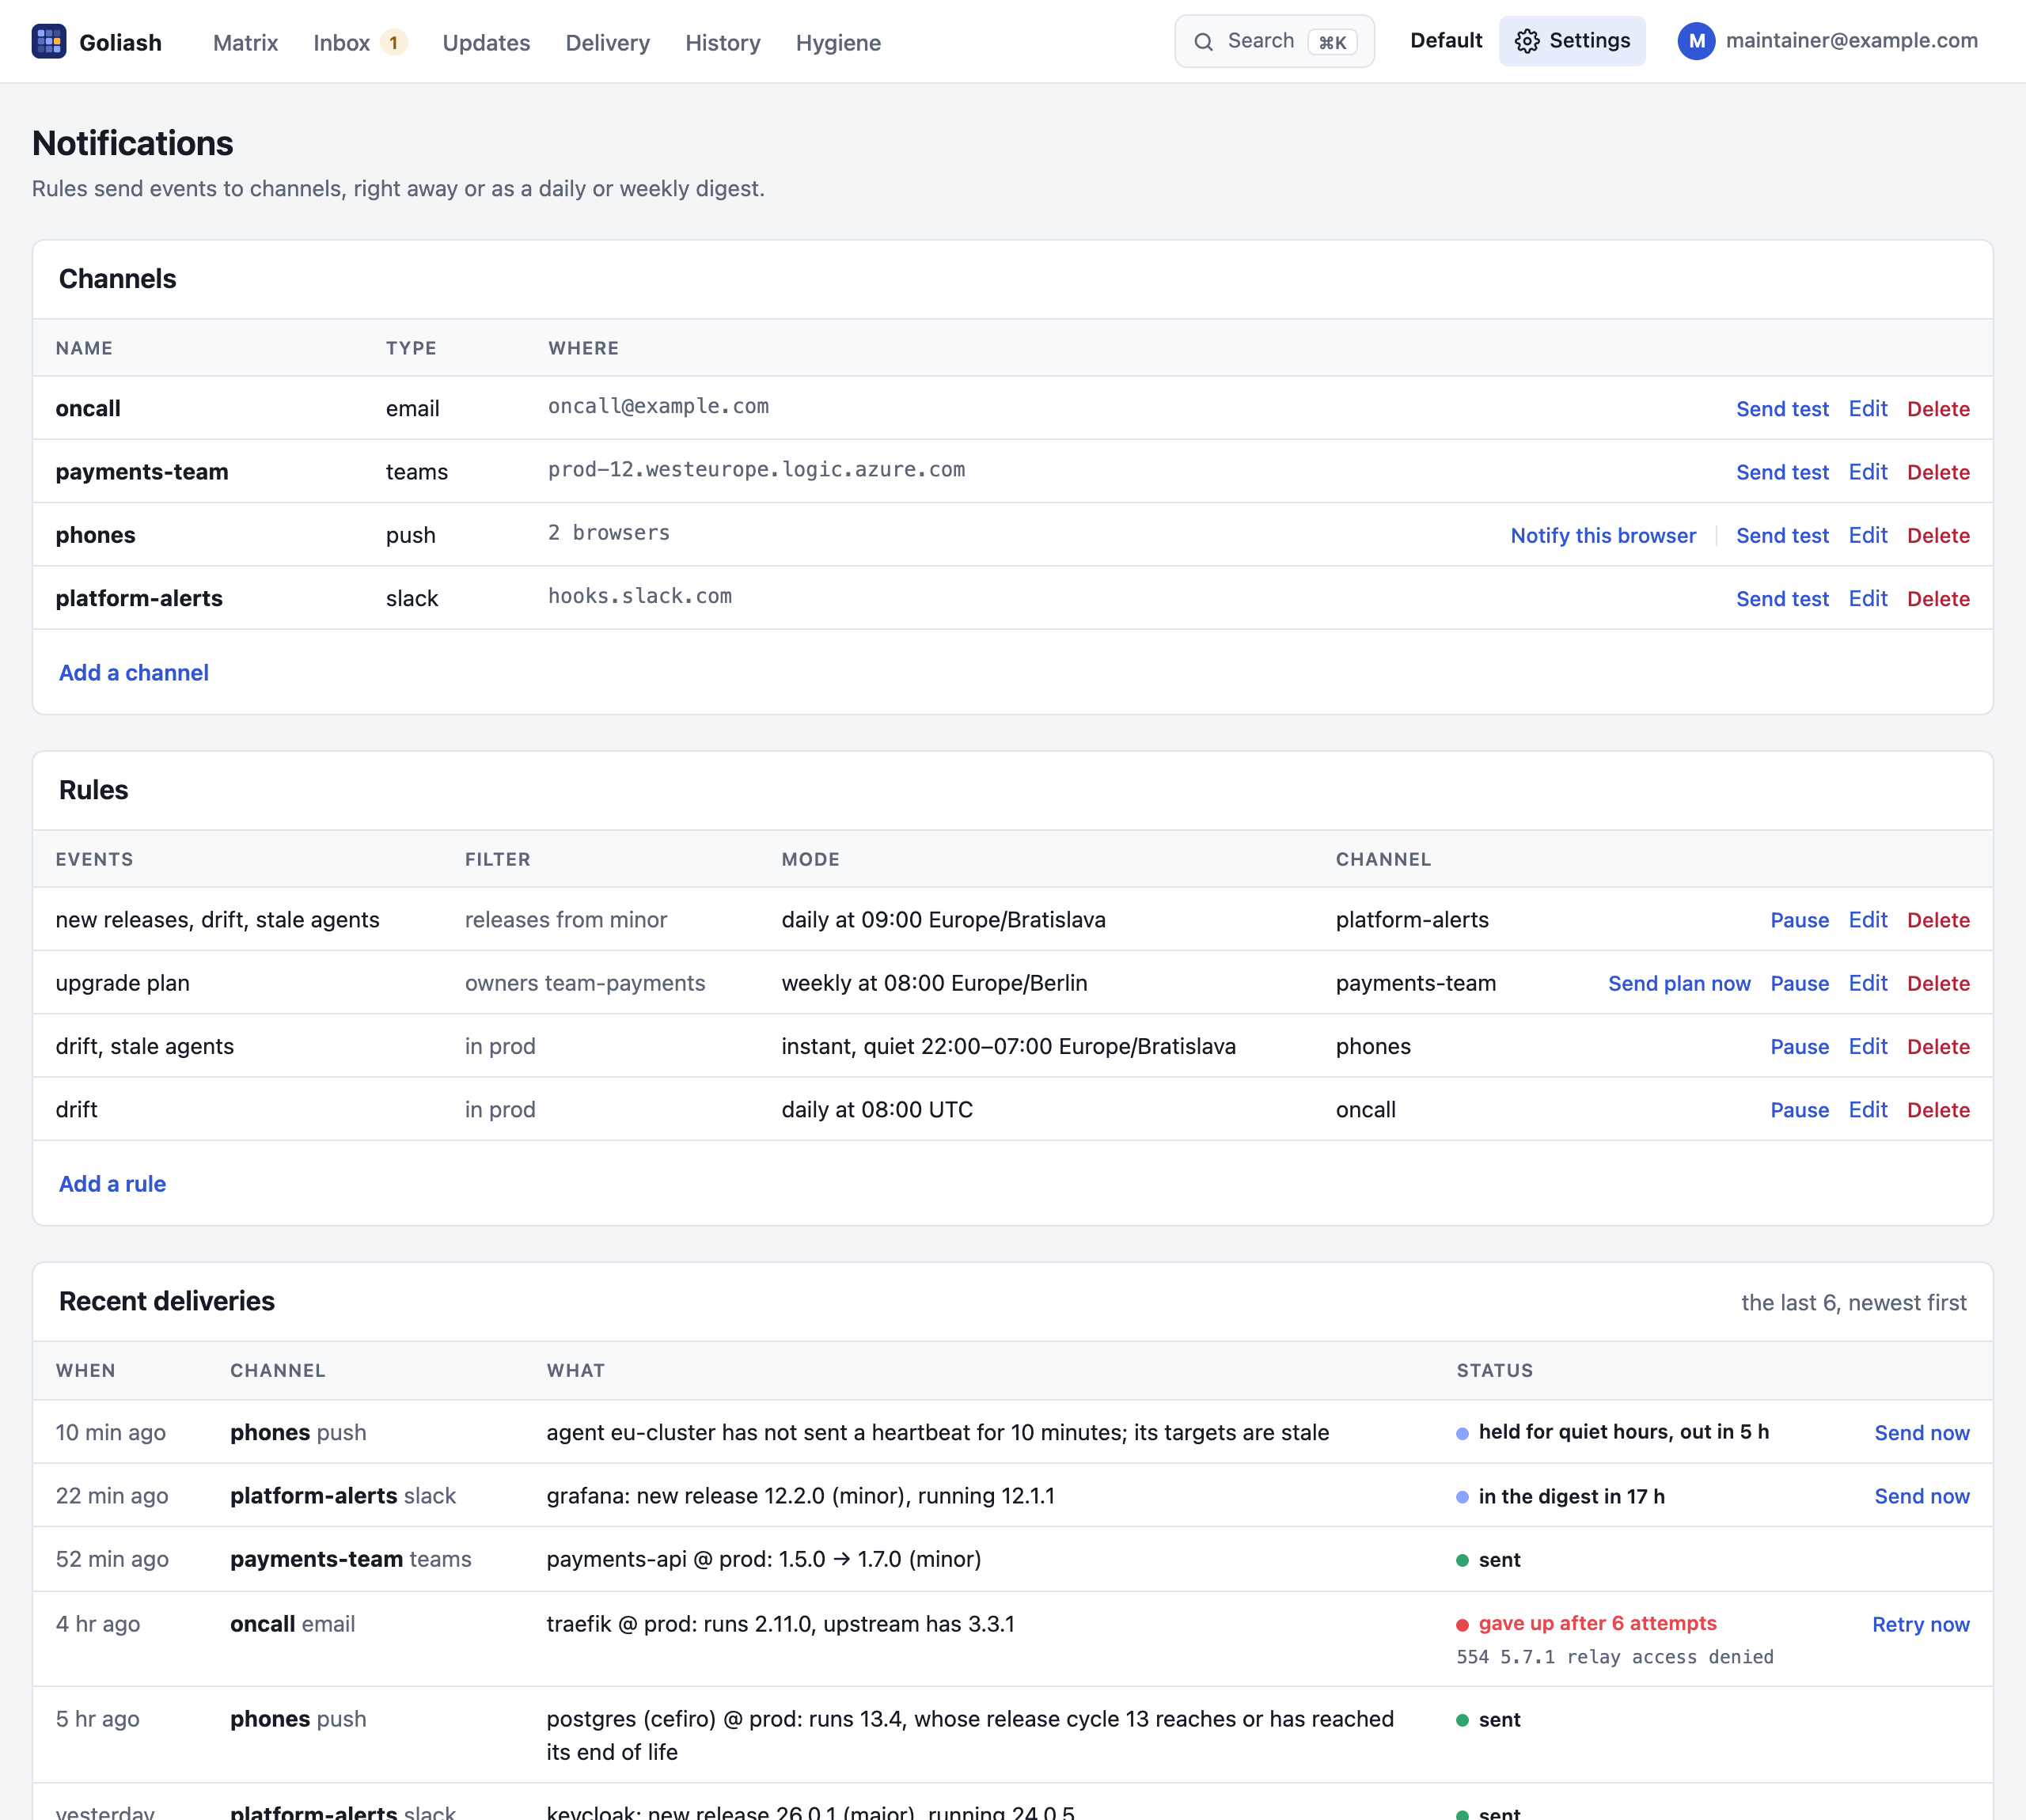
Channels
Section titled “Channels”| Type | Settings |
|---|---|
| Slack | An incoming webhook URL. Mattermost and Rocket.Chat incoming webhooks take the same messages. |
| Microsoft Teams | The URL of a Teams workflow: in the channel, Workflows → Post to a channel when a webhook request is received. |
| Google Chat | A space’s webhook URL: in the space, Apps & integrations → Webhooks. |
| Discord | A channel webhook URL (Channel settings → Integrations → Webhooks). |
| Telegram | A bot token from @BotFather and the chat ID the bot posts to. |
| ntfy | A topic URL on ntfy.sh or your own server, e.g. https://ntfy.sh/my-goliash, and an optional access token. |
| Grafana | Grafana’s URL and a service account token with annotations:write; every item becomes an annotation. |
| Webhook | A URL and an optional signing secret. |
| Recipients, and optionally the channel’s own mail server (see below). | |
| Web push | Nothing: each person adds their browsers from the Notifications page (see below). |
goliash channel create -type slack -name ops -url https://hooks.slack.com/services/…goliash channel create -type webhook -name ci -url https://example.com/goliash -secret s3cretgoliash channel create -type discord -name releases -url https://discord.com/api/webhooks/…goliash channel create -type teams -name platform -url https://prod-00.westeurope.logic.azure.com/workflows/…goliash channel create -type gchat -name sre -url "https://chat.googleapis.com/v1/spaces/…/messages?key=…&token=…"goliash channel create -type telegram -name team -token 123456:ABC… -chat-id -1001234567890goliash channel create -type ntfy -name phone -url https://ntfy.sh/my-goliashgoliash channel create -type email -name oncall -to oncall@example.comgoliash channel test -name opsChannel URLs and secrets are encrypted at rest and never shown in full in the UI.
Mail goes through the server’s relay (GOLIASH_SMTP_*, see Configuration), or
through the channel’s own mail server: open Own mail server when adding the channel, or edit it later, and give
the server as host:port, the sender address, and a user name and password if it needs them. Encryption is TLS on port
465 and STARTTLS elsewhere unless you pick one; None is for a relay on the same host or network. The password is
encrypted with the other channel secrets and never shown again; leave it empty when editing to keep it. Send test
checks the whole path. Without a relay on the server, an e-mail channel needs its own.
GOLIASH_CHANNEL_SMTP_PASSWORD=… goliash channel create -type email -name oncall -to oncall@example.com \ -smtp-addr smtp.example.com:587 -smtp-from goliash@example.com -smtp-username goliashWeb push
Section titled “Web push”A Web push channel sends to browsers: desktop notifications in Chrome, Edge, Firefox and Safari, and on phones. Add the channel, then press Notify this browser next to it in every browser that should get its notifications (the browser asks for permission once); Stop on this browser takes it off again. Anyone with access to the workspace can add their own browsers; the channel shows how many are on it. Rules pick the events as for any other channel, so a channel for releases and another for end-of-life drift each go only where they were added.
A notification shows the item’s kind, service and change, and opens Goliash on that service when clicked; digests show the first lines. Browsers that unsubscribed or expired are forgotten at the next message.
- Goliash needs HTTPS (or
localhost) for browsers to allow push;GOLIASH_PUBLIC_URLshould be that address. - On iPhone and iPad (iOS 16.4 or later), add Goliash to the home screen first (Share → Add to Home Screen), then open it from there and press Notify this browser.
- Apple’s push service (iPhone, iPad, Safari) only accepts pushes from a server that says who it is: an https
GOLIASH_PUBLIC_URL(orGOLIASH_PUSH_SUBJECT=mailto:you@example.com). Without one the Notifications page says so, and Apple devices get nothing while Chrome, Edge and Firefox do. - Send test reports every browser: which got it, which did not and what its push service answered (for example
web.push.apple.com answered 403: BadJwtToken), and which had unsubscribed. - Messages are encrypted for each browser (RFC 8291) and signed with a key pair the server makes on first use and
keeps with the other secrets (encrypted at rest with
GOLIASH_SECRET_KEY). The server sends only to the push services of browsers (Google, Mozilla, Apple, Microsoft).
How messages look
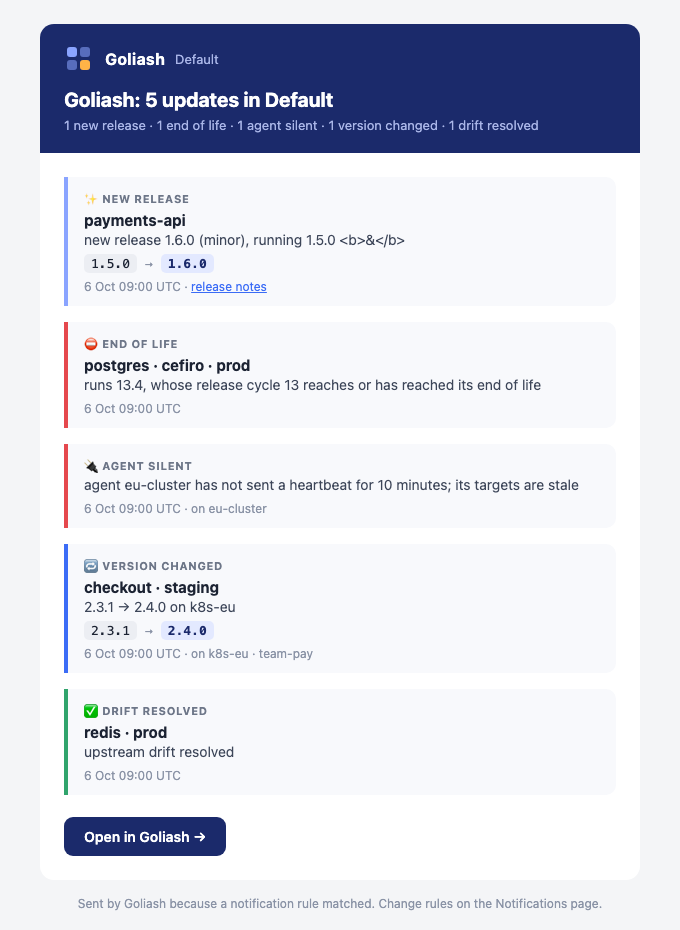
Section titled “How messages look”Every item carries its kind, as an emoji and a colour: a new release ✨, drift ⚠️, an end of life ⛔, a resolved
drift ✅, an update ⬆️ coloured by urgency, a silent agent 🔌. With GOLIASH_PUBLIC_URL set, messages link back:
each item opens the matrix filtered to its service, and a button opens Goliash (the Updates page for an upgrade plan).
- Slack gets Block Kit: a header and a count by kind for digests, one section per item with the versions
(
1.5.0→1.6.0), a Release notes button, and Open in Goliash at the end; up to 20 items, then a count. - Discord gets one coloured embed per item (up to ten; longer digests stay a list).
- Microsoft Teams gets an Adaptive Card: the title and count, one container per item in the kind’s colour (attention, warning, good) with the versions, target and team, a Release notes button, and Open in Goliash.
- Google Chat gets a card with the logo in its header, one line per item with its kind, the versions in colour and a button (release notes, or the service in Goliash), and Open in Goliash at the bottom.
- E-mail is HTML with a plain-text alternative, in the logo’s colours, readable in any mail client.
- Web push shows the kind’s emoji and the service as the title, and the change as the text.
A rule sends some event types to a channel, optionally only for some services, owners (teams), applications or
environments, or only for releases of at least a given size. Applications are matched by the names the matrix shows
(after renames and merges, see Applications and teams): a rule for webshop gets every service
running in it, and a drift only when it is in that application.
A rule that sends stale agents (an agent silent for 10 minutes) also sends the all clear when the agent is back: ✅ agent eu-cluster is back after about 25 min; its targets report again.
goliash notify create -channel ops -events new_release,drift_detected,agent_stale -mode daily -min-jump minorgoliash notify create -channel oncall -events drift_detected -envs prod -mode instant| Mode | Delivery |
|---|---|
instant |
Within seconds. Items arriving together are sent as one message. |
daily |
A digest every day at the digest hour (Digest at, default 08:00). |
weekly |
A digest every Monday at the digest hour. |
The digest hour is in the rule’s time zone (any IANA name, such as Europe/Bratislava; UTC when empty), so
08:00 stays 08:00 across daylight saving time.
Quiet hours keep right-away rules from waking people: what comes in during them is held and sent together, as one message, when they end (22:00–07:00 overnight, or 09:00–17:00 for a channel only read after work). Combine them with a web push channel for a phone that buzzes only by day.
goliash notify create -channel phones -events drift_detected,agent_stale -timezone Europe/Bratislava -quiet 22-7goliash notify create -channel ops -mode daily -digest-hour 9 -timezone America/New_YorkAdmins edit a channel (secrets are never shown again; an empty field keeps the stored value). Members edit a rule (its channel, events, mode, digest hour and filters), pause it (it queues nothing until resumed) or delete it on the Notifications page; admins delete a channel together with its rules. An edit applies to what comes next: notifications already queued keep their channel and time.
A release is announced once per service and version. Failed deliveries are retried with backoff, after 1, 2, 4, 8 and 16 minutes, then given up; see Recent deliveries. Acknowledged releases and drift are not sent; see Acknowledging.
Recent deliveries
Section titled “Recent deliveries”The bottom of the Notifications page lists the last 25 notifications and how each went: sent, waiting in the digest until its hour, attempt N failed with the error and when it is tried next (after 1, 2, 4, 8 and 16 minutes), or gave up after 6 attempts. Retry now sends a failed one at once and says whether it went through; Send now sends one waiting for its digest. A wrong webhook URL or a revoked Slack hook shows here with what the service answered.
Upgrade plan
Section titled “Upgrade plan”A rule with the event type updates_plan (upgrade plan in the form) sends the Updates
list at its digest time: every day for a daily rule, on Mondays for a weekly (or instant) one. It is one message, most
urgent first: what runs, the version to move to, why, and the release notes. Updates put off with an acknowledgement
are left out, and the rule’s services, owners and environments apply, so each team can get its own plan:
goliash notify create -channel team-payments -events updates_plan -owners team-payments -mode weeklySend plan now on the rule sends its plan at once, to check the channel and the filters without waiting for Monday; the scheduled plans are not affected.
Deploys on your dashboards
Section titled “Deploys on your dashboards”A Grafana channel turns events into annotations, so a deploy shows up on the graphs it may have changed:
goliash channel create -type grafana -name dashboards -url https://grafana.example.com -token glsa_…goliash notify create -channel dashboards -events deployed,version_changed,removed -envs prod -mode instantAnnotations are tagged goliash, the event type, the service and the environment. In a dashboard, add an
annotation query on the built-in Grafana data source, filtered by tags (goliash, and for example prod).
What changed before an incident
Section titled “What changed before an incident”The History page has a changed in the last hour / 6 hours / 24 hours / 7 days filter, and the same works from the command line and the API:
goliash events -env prod -since 2hcurl -H "Authorization: Bearer $GOLIASH_TOKEN" "https://goliash.example.com/api/v1/events?environment=prod&since=2h"Webhook payload
Section titled “Webhook payload”{ "workspace": "Default", "digest": false, "link": "https://goliash.example.com", "items": [{ "type": "new_release", "service": "payments-api", "owner": "team-payments", "from": "1.6.0", "to": "1.7.0", "note": "minor", "at": "2026-10-03T08:00:00Z", "text": "payments-api: new release 1.7.0 (minor), running 1.6.0", "url": "https://github.com/acme/payments-api/releases/tag/v1.7.0" }]}environment, target and url are present when they apply; link is the server’s public URL. With a secret, the request carries
X-Goliash-Timestamp and X-Goliash-Signature: sha256=<hex>, where the hex is
HMAC-SHA256(secret, timestamp + "." + body). Check the signature and reject old timestamps:
import hashlib, hmac, time
def verify(secret: bytes, timestamp: str, body: bytes, signature: str) -> bool:    if abs(time.time() - int(timestamp)) > 300:        return False    expected = hmac.new(secret, timestamp.encode() + b"." + body, hashlib.sha256).hexdigest()    return hmac.compare_digest("sha256=" + expected, signature)
Metrics instead of messages
Section titled “Metrics instead of messages”If you alert from Prometheus, scrape GET /metrics with an API token instead:
| Metric | Labels | Value |
|---|---|---|
goliash_deployed_version_info |
service, environment, version | running replicas |
goliash_outdated |
service, environment | 1 when behind upstream by the tracked jump |
goliash_drift_days |
service, environment, kind (and app, for a service compared per application) | days a drift has been open |
goliash_deploys |
service, environment | versions that arrived in the last 30 days |
goliash_lead_time_seconds |
service, from, to | median time a version took to the next environment, last 30 days |
goliash_image_hygiene_findings |
kind | images with a moving tag, a tag pushed again, an untrusted registry or no digest |
goliash_build_info |
version | 1 |
goliash_leader |
1 on the server that runs the background work | |
goliash_snapshots_pending |
snapshots received and not processed yet | |
goliash_notifications_queued, goliash_notifications_failing |
notifications not sent yet, and those that failed at least once | |
goliash_agents |
status | agents online, stale, never connected or revoked |
Alerts worth having on Goliash itself: goliash_agents{status="stale"} > 0, goliash_snapshots_pending > 20 for
ten minutes, goliash_notifications_failing > 0, and sum(goliash_leader) != 1 across servers.
scrape_configs: - job_name: goliash scheme: https authorization: { credentials_file: /etc/prometheus/goliash-token } static_configs: [{ targets: ["goliash.example.com"] }]A ready-made Grafana dashboard is in
deploy/grafana/goliash-dashboard.json:
open Dashboards → New → Import in Grafana and upload the file. It shows what runs where, open drift, services
behind upstream per environment, and services running more than one version, filterable by environment and
service.
For SigNoz, scrape /metrics with the OpenTelemetry Collector’s Prometheus receiver and import
deploy/signoz/goliash-dashboard.json;
the README has the collector configuration.